HP 2010 Annual Report Download - page 108
Download and view the complete annual report
Please find page 108 of the 2010 HP annual report below. You can navigate through the pages in the report by either clicking on the pages listed below, or by using the keyword search tool below to find specific information within the annual report.-
 1
1 -
2
-
3
-
4
-
5
-
6
-
7
-
8
-
9
-
10
-
11
-
12
-
13
-
14
-
15
-
16
-
17
-
18
-
19
-
20
-
21
-
22
-
23
-
24
-
25
-
26
-
27
-
28
-
29
-
30
-
31
-
32
-
33
-
34
-
35
-
36
-
37
-
38
-
39
-
40
-
41
-
42
-
43
-
44
-
45
-
46
-
47
-
48
-
49
-
50
-
51
-
52
-
53
-
54
-
55
-
56
-
57
-
58
-
59
-
60
-
61
-
62
-
63
-
64
-
65
-
66
-
67
-
68
-
69
-
70
-
71
-
72
-
73
-
74
-
75
-
76
-
77
-
78
-
79
-
80
-
81
-
82
-
83
-
84
-
85
-
86
-
87
-
88
-
89
-
90
-
91
-
92
-
93
-
94
-
95
-
96
-
97
-
 98
98 -
 99
99 -
 100
100 -
 101
101 -
 102
102 -
 103
103 -
 104
104 -
 105
105 -
 106
106 -
 107
107 -
 108
108 -
 109
109 -
 110
110 -
 111
111 -
 112
112 -
 113
113 -
 114
114 -
 115
115 -
 116
116 -
 117
117 -
 118
118 -
119
-
120
-
121
-
122
-
123
-
124
-
125
-
126
-
127
-
128
-
129
-
130
-
131
-
132
-
133
-
134
-
135
-
136
-
137
-
138
-
139
-
140
-
141
-
142
-
143
-
144
-
145
-
146
-
147
-
148
-
149
-
150
-
151
-
152
-
153
-
154
-
155
-
156
-
157
-
158
-
159
-
160
-
161
-
162
-
163
-
164
-
165
-
166
-
167
-
168
-
169
-
170
-
171
-
172
-
173
-
174
-
175
-
176
-
177
-
178
-
179
-
180
 |
 |

HEWLETT-PACKARD COMPANY AND SUBSIDIARIES
Notes to Consolidated Financial Statements (Continued)
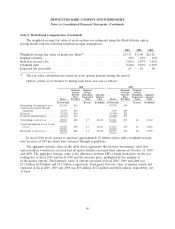
Note 6: Acquisitions (Continued)
for depreciation expense for property, plant and equipment, adjustments to interest expense and related
tax effects.
In millions, except per share data 2008
Net revenue ........................................................... $136,022
Net earnings .......................................................... $ 7,828
Basic net earnings per share ............................................... $ 3.15
Diluted net earnings per share ............................................. $ 3.05
Note 7: Goodwill and Purchased Intangible Assets
Goodwill
Goodwill allocated to HP’s business segments as of October 31, 2010 and 2009 and changes in the
carrying amount of goodwill during the fiscal year ended October 31, 2010 and 2009 are as follows:
Enterprise Imaging
Storage Personal and HP
and HP Systems Printing Financial Corporate
Services Servers Software Group Group Services Investments Total
In millions
Balance at October 31,
2008 ............. $16,284 $4,745 $6,162 $2,493 $2,463 $144 $ 44 $32,335
Goodwill acquired
during the period .... — 315 — — — — — 315
Goodwill adjustments . . 545 (55) (22) (6) (3) — — 459
Balance at October 31,
2009 ............. $16,829 $5,005 $6,140 $2,487 $2,460 $144 $ 44 $33,109
Goodwill acquired
during the period .... 17 1,635 1,407 18 — — 2,153 5,230
Goodwill adjustments . . 121 (30) (2) (5) (4) — 64 144
Balance at October 31,
2010 ............. $16,967 $6,610 $7,545 $2,500 $2,456 $144 $2,261 $38,483
During fiscal 2010, HP recorded approximately $5.2 billion of goodwill related to acquisitions
based on its preliminary purchase price allocations. In addition, HP recorded goodwill adjustments
primarily related to an increase to the deferred tax liability on outside basis differences of EDS foreign
subsidiaries at acquisition. HP also recorded an increase to goodwill as a result of currency translation
related to 3Com’s subsidiary whose functional currency is not the U.S. dollar. These increases to
goodwill were partially offset by tax adjustments primarily related to tax deductible stock-based awards
for certain acquisitions for which the acquisition date preceded the effective date of the new accounting
standard for business combinations.
During fiscal 2009, HP recorded adjustments of approximately $306 million to the estimated fair
values of EDS’s intangible assets and net liabilities acquired resulting in an increase to EDS’s goodwill,
which is allocated to the Services segment. These changes in the estimated fair values relate primarily
to restructuring liabilities, fixed assets, net deferred tax liabilities and intangible assets. In addition,
100