HP 2010 Annual Report Download - page 162
Download and view the complete annual report
Please find page 162 of the 2010 HP annual report below. You can navigate through the pages in the report by either clicking on the pages listed below, or by using the keyword search tool below to find specific information within the annual report.-
 1
1 -
2
-
3
-
4
-
5
-
6
-
7
-
8
-
9
-
10
-
11
-
12
-
13
-
14
-
15
-
16
-
17
-
18
-
19
-
20
-
21
-
22
-
23
-
24
-
25
-
26
-
27
-
28
-
29
-
30
-
31
-
32
-
33
-
34
-
35
-
36
-
37
-
38
-
39
-
40
-
41
-
42
-
43
-
44
-
45
-
46
-
47
-
48
-
49
-
50
-
51
-
52
-
53
-
54
-
55
-
56
-
57
-
58
-
59
-
60
-
61
-
62
-
63
-
64
-
65
-
66
-
67
-
68
-
69
-
70
-
71
-
72
-
73
-
74
-
75
-
76
-
77
-
78
-
79
-
80
-
81
-
82
-
83
-
84
-
85
-
86
-
87
-
88
-
89
-
90
-
91
-
92
-
93
-
94
-
95
-
96
-
97
-
98
-
99
-
100
-
101
-
102
-
103
-
104
-
105
-
106
-
107
-
108
-
109
-
110
-
111
-
112
-
113
-
114
-
115
-
116
-
117
-
118
-
119
-
120
-
121
-
122
-
123
-
124
-
125
-
126
-
127
-
128
-
129
-
130
-
131
-
132
-
133
-
134
-
135
-
136
-
137
-
138
-
139
-
140
-
141
-
142
-
143
-
144
-
145
-
146
-
147
-
148
-
149
-
150
-
151
-
 152
152 -
 153
153 -
 154
154 -
 155
155 -
 156
156 -
 157
157 -
 158
158 -
 159
159 -
 160
160 -
 161
161 -
 162
162 -
 163
163 -
 164
164 -
 165
165 -
 166
166 -
 167
167 -
 168
168 -
 169
169 -
 170
170 -
 171
171 -
 172
172 -
173
-
174
-
175
-
176
-
177
-
178
-
179
-
180
 |
 |

HEWLETT-PACKARD COMPANY AND SUBSIDIARIES
Notes to Consolidated Financial Statements (Continued)
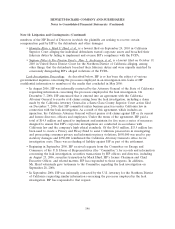
Note 19: Segment Information (Continued)
Net revenue by segment and business unit
The following table provides net revenue by segment and business unit for the following fiscal
years ended October 31:
2010 2009(3) 2008(3)
In millions
Net revenue:
Infrastructure technology outsourcing .................... $ 15,963 $ 15,554 $ 7,778
Technology services .................................. 9,681 9,719 10,007
Application services ................................. 6,123 6,194 2,411
Business process outsourcing ........................... 2,872 2,977 723
Other ........................................... 296 249 58
Services(1) .......................................... 34,935 34,693 20,977
Industry standard servers ............................. 12,574 9,296 11,657
Storage .......................................... 3,785 3,473 4,205
Business critical systems .............................. 2,292 2,590 3,538
Enterprise Storage and Servers ........................... 18,651 15,359 19,400
Business technology optimization ........................ 2,440 2,385 2,792
Other software ..................................... 1,146 1,187 1,428
HP Software ........................................ 3,586 3,572 4,220
HP Enterprise Business .................................. 57,172 53,624 44,597
Notebooks ........................................ 22,545 20,210 22,657
Desktops ......................................... 15,478 12,864 16,643
Workstations ...................................... 1,786 1,261 1,885
Handhelds ........................................ 87 172 360
Other ........................................... 845 798 750
Personal Systems Group ................................. 40,741 35,305 42,295
Supplies .......................................... 17,249 16,532 18,472
Commercial hardware ................................ 5,569 4,778 7,422
Consumer hardware ................................. 2,946 2,701 3,720
Imaging and Printing Group .............................. 25,764 24,011 29,614
HP Financial Services ................................... 3,047 2,673 2,698
Corporate Investments(2) ................................. 1,863 768 965
Total segments ..................................... 128,587 116,381 120,169
Eliminations of inter-segment net revenue and other ............. (2,554) (1,829) (1,805)
Total HP consolidated net revenue ...................... $126,033 $114,552 $118,364
(1) Includes the results of EDS, which was acquired on August 26, 2008, from the date of acquisition.
(2) Includes the results of 3Com and Palm acquisitions completed in April 2010 and July 2010,
respectively.
(3) Certain fiscal 2010 organizational reclassifications have been reflected retroactively to provide
improved visibility and comparability. In fiscal 2009 and fiscal 2008, the reclassifications resulted in
the transfer of revenue among the business units within the Services segment only. There was no
impact on the previously reported segment financial results.
154