HSBC 2013 Annual Report Download - page 10
Download and view the complete annual report
Please find page 10 of the 2013 HSBC annual report below. You can navigate through the pages in the report by either clicking on the pages listed below, or by using the keyword search tool below to find specific information within the annual report.-
 1
1 -
 2
2 -
 3
3 -
 4
4 -
 5
5 -
 6
6 -
 7
7 -
 8
8 -
 9
9 -
 10
10 -
 11
11 -
 12
12 -
 13
13 -
 14
14 -
 15
15 -
 16
16 -
 17
17 -
 18
18 -
 19
19 -
 20
20 -
 21
21 -
22
-
23
-
24
-
25
-
26
-
27
-
28
-
29
-
30
-
31
-
32
-
33
-
34
-
35
-
36
-
37
-
38
-
39
-
40
-
41
-
42
-
43
-
44
-
45
-
46
-
47
-
48
-
49
-
50
-
51
-
52
-
53
-
54
-
55
-
56
-
57
-
58
-
59
-
60
-
61
-
62
-
63
-
64
-
65
-
66
-
67
-
68
-
69
-
70
-
71
-
72
-
73
-
74
-
75
-
76
-
77
-
78
-
79
-
80
-
81
-
82
-
83
-
84
-
85
-
86
-
87
-
88
-
89
-
90
-
91
-
92
-
93
-
94
-
95
-
96
-
97
-
98
-
99
-
100
-
101
-
102
-
103
-
104
-
105
-
106
-
107
-
108
-
109
-
110
-
111
-
112
-
113
-
114
-
115
-
116
-
117
-
118
-
119
-
120
-
121
-
122
-
123
-
124
-
125
-
126
-
127
 |
 |

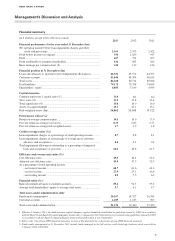
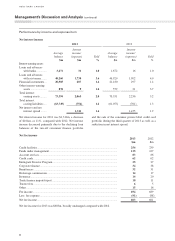
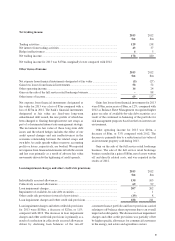
Performance by income and expense item
Net interest income
2013 2012
Average
balance
$m
Interest
income/
(expense
$m
) Yield
%
Average
balance
$m
Interest
income/
(expense
$m) Yield
%
Interest-earning assets
Loans and advances
with banks .............. 3,271 31 1.0 1,672 16 1.0
Loans and advances
with customers ....... 48,260 1,738 3.6 46,920 1,902 4.0
Financial instruments ... 20,985 287 1.4 21,180 297 1.4
Other interest-earning
assets ...................... 878 9 1.0 579 21 3.7
Total interest
earning assets ......... 73,394 2,065 2.8 70,351 2,236 3.2
Total interest
costing liabilities .... (63,749) (754) 1.2 (61,073) (761) 1.3
Net interest and net
interest spread ........ 1,311 1.6 1,475 1.9
Net interest income for 2013 was $1,311m, a decrease
of $164m, or 11%, compared with 2012. Net interest
income decreased primarily due to the declining loan
balances of the run-off consumer finance portfolio
and the sale of the consumer private label credit card
portfolio during the third quarter of 2013 as well as a
reduction in net interest spread.
Net fee income
2013
$m
2012
$m
Credit facilities ............................................................................................................... 254 239
Funds under management .............................................................................................. 135 127
Account services ............................................................................................................ 83 86
Credit cards .................................................................................................................... 62 62
Immigrant Investor Program .......................................................................................... 35 37
Corporate finance ........................................................................................................... 34 38
Remittances .................................................................................................................... 32 31
Brokerage commissions ................................................................................................. 14 17
Insurance ........................................................................................................................ 14 20
Trade finance import/export ........................................................................................... 10 11
Trustee fees .................................................................................................................... 65
Other .............................................................................................................................. 15 16
Fee income ..................................................................................................................... 694 689
Less: fee expense ........................................................................................................... (91) (88)
Net fee income ............................................................................................................... 603 601
Net fee income for 2013 was $603m, broadly unchanged compared with 2012.
HSBC BANK CANADA
Management’s Discussion and Analysis (continued)
8