HSBC 2013 Annual Report Download - page 6
Download and view the complete annual report
Please find page 6 of the 2013 HSBC annual report below. You can navigate through the pages in the report by either clicking on the pages listed below, or by using the keyword search tool below to find specific information within the annual report.-
 1
1 -
 2
2 -
 3
3 -
 4
4 -
 5
5 -
 6
6 -
 7
7 -
 8
8 -
 9
9 -
 10
10 -
 11
11 -
 12
12 -
 13
13 -
 14
14 -
 15
15 -
 16
16 -
 17
17 -
18
-
19
-
20
-
21
-
22
-
23
-
24
-
25
-
26
-
27
-
28
-
29
-
30
-
31
-
32
-
33
-
34
-
35
-
36
-
37
-
38
-
39
-
40
-
41
-
42
-
43
-
44
-
45
-
46
-
47
-
48
-
49
-
50
-
51
-
52
-
53
-
54
-
55
-
56
-
57
-
58
-
59
-
60
-
61
-
62
-
63
-
64
-
65
-
66
-
67
-
68
-
69
-
70
-
71
-
72
-
73
-
74
-
75
-
76
-
77
-
78
-
79
-
80
-
81
-
82
-
83
-
84
-
85
-
86
-
87
-
88
-
89
-
90
-
91
-
92
-
93
-
94
-
95
-
96
-
97
-
98
-
99
-
100
-
101
-
102
-
103
-
104
-
105
-
106
-
107
-
108
-
109
-
110
-
111
-
112
-
113
-
114
-
115
-
116
-
117
-
118
-
119
-
120
-
121
-
122
-
123
-
124
-
125
-
126
-
127
 |
 |

HSBC BANK CANADAHSBC BANK CANADA
4
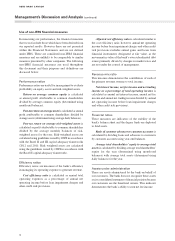
Management’s Discussion and Analysis (continued)
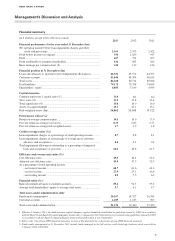
Use of non-IFRS financial measures
In measuring our performance, the financial measures
that we use include those which have been derived from
our reported results. However these are not presented
within the Financial Statements and are not defined
under IFRS. These are considered non-IFRS financial
measures and are unlikely to be comparable to similar
measures presented by other companies. The following
non-IFRS financial measures are used throughout
this document and their purposes and definitions are
discussed below:
Performance ratios
Performance ratios are useful for management to evaluate
profitability on equity, assets and risk-weighted assets.
Return on average common equity is calculated
as annual profit attributable to common shareholders
divided by average common equity (determined using
month-end balances).
Post-tax return on average assets is calculated as annual
profit attributable to common shareholders divided by
average assets (determined using average daily balances).
Post-tax return on average risk-weighted assets is
calculated as profit attributable to common shareholders
divided by the average monthly balances of risk-
weighted assets for the year. Risk-weighted assets are
calculated using guidelines issued by OSFI in accordance
with the Basel II and III capital adequacy frameworks
(2012 and 2011: Risk weighted assets are calculated
using the guidelines issued by OSFI in accordance with
the Basel II capital adequacy framework).
Efficiency ratios
Efficiency ratios are measures of the bank’s efficiency
in managing its operating expense to generate revenue.
Cost efficiency ratio is calculated as annual total
operating expenses as a percentage of annual net
operating income before loan impairment charges and
other credit risk provisions.
Adjusted cost efficiency ratio is calculated similar to
the cost efficiency ratio; however, annual net operating
income before loan impairment charges and other credit
risk provisions excludes annual gains and losses from
financial instruments designated at fair value, as the
movement in value of the bank’s own subordinated debt
issues primarily driven by changes in market rates and
are not under the control of management.
Revenue mix ratio
This measure demonstrates the contribution of each of
the primary revenue streams to total income.
Net interest income, net fee income and net trading
income as a percentage of total operating income is
calculated as annual net interest income, annual net fee
income and annual net trading income divided by annual
net operating income before loan impairment charges
and other credit risk provisions.
Financial ratios
These measures are indicators of the stability of the
bank’s balance sheet and the degree funds are deployed
to fund assets.
Ratio of customer advances to customer accounts is
calculated by dividing loans and advances to customers
by customer accounts using year-end balances.
Average total shareholders’ equity to average total
assets is calculated by dividing average total shareholders’
equity for the year (determined using month-end
balances) with average total assets (determined using
daily balances) for the year.
Assets under administration
These are assets administered by the bank on behalf of
our customers. The bank does not recognize these assets
on its consolidated statement of financial position because
our customers are the beneficial owners. This indicator
demonstrates the bank’s ability to earn net fee income.