HSBC 2013 Annual Report Download - page 17
Download and view the complete annual report
Please find page 17 of the 2013 HSBC annual report below. You can navigate through the pages in the report by either clicking on the pages listed below, or by using the keyword search tool below to find specific information within the annual report.-
 1
1 -
2
-
3
-
4
-
5
-
6
-
 7
7 -
 8
8 -
 9
9 -
 10
10 -
 11
11 -
 12
12 -
 13
13 -
 14
14 -
 15
15 -
 16
16 -
 17
17 -
 18
18 -
 19
19 -
 20
20 -
 21
21 -
 22
22 -
 23
23 -
 24
24 -
 25
25 -
 26
26 -
 27
27 -
28
-
29
-
30
-
31
-
32
-
33
-
34
-
35
-
36
-
37
-
38
-
39
-
40
-
41
-
42
-
43
-
44
-
45
-
46
-
47
-
48
-
49
-
50
-
51
-
52
-
53
-
54
-
55
-
56
-
57
-
58
-
59
-
60
-
61
-
62
-
63
-
64
-
65
-
66
-
67
-
68
-
69
-
70
-
71
-
72
-
73
-
74
-
75
-
76
-
77
-
78
-
79
-
80
-
81
-
82
-
83
-
84
-
85
-
86
-
87
-
88
-
89
-
90
-
91
-
92
-
93
-
94
-
95
-
96
-
97
-
98
-
99
-
100
-
101
-
102
-
103
-
104
-
105
-
106
-
107
-
108
-
109
-
110
-
111
-
112
-
113
-
114
-
115
-
116
-
117
-
118
-
119
-
120
-
121
-
122
-
123
-
124
-
125
-
126
-
127
 |
 |

15
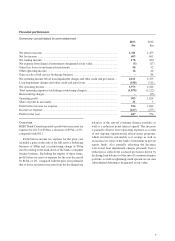
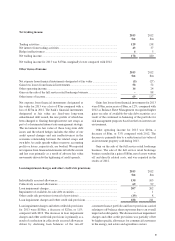
Review of financial performance
2013
$m
2012
$m
Net interest income ........................................................................................................ 159 167
Net fee income ............................................................................................................... 83 87
Net trading income ......................................................................................................... 103 106
Gains less losses from financial investments ................................................................. 54 51
Other operating income .................................................................................................. 12
Gain on sale of the full service retail brokerage business ............................................... –8
Net operating income ..................................................................................................... 400 421
Total operating expenses ................................................................................................ (113) (112)
Profit before income tax expense ................................................................................... 287 309
Overview
Profit before income tax expense was $287m for 2013,
a decrease of $22m, or 7%, compared with 2012. Profit
before income tax in 2012 included a gain of $8m on the
sale of full services retail brokerage business.
Excluding the impact of the gain, profit before income
tax expense decreased by $14m, or 5%, compared with
2012 primarily due to lower net interest income from
reduced interest margin, lower trading income as a result
of a decline in customer spreads on foreign exchange
products, as well as lower net fee income from a decline
in derivative sales and debt underwriting fees.
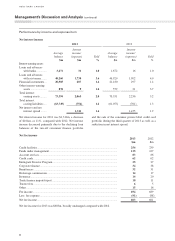
Financial performance by income and expense item
Net interest income for 2013 was $159m, a decrease
of $8m, or 5%, compared with 2012 primarily due to
lower interest margin.
Net fee income for 2013 was $83m, a decrease of $4m,
or 5% compared with 2012 primarily due to lower
derivative sales and debt underwriting fees.
Net trading income for 2013 was $103m, a decrease of
$3m, or 3%, compared with 2012. Net trading income
decreased primarily as a result of lower customer
spreads related to foreign exchange products and lower
trading income generated from rates products. In the
first quarter of 2013, the bank implemented changes in
the methodology in respect of credit and debit valuation
adjustments on derivative contracts to reflect evolving
market practices. The decrease in net trading income was
partially offset as a result of the change in methodology
as well as prior year losses caused by the narrowing of
credit spreads on our own instruments.
Gains less losses from financial investments for 2013
was $54m, an increase of $3m, or 6%, compared
with 2012 as Balance Sheet Management recognized
higher gains on sales of available-for-sale debt
securities as a result of the continued re-balancing of
the portfolio for risk management purposes based on
the low interest rate environment.
Total operating expenses for 2013 were $113m, broadly
unchanged compared with 2012.
Retail Banking and Wealth Management
Retail Banking and Wealth Management provides
banking and wealth management services for our
personal customers to help them to manage their
finances and protect and build their financial future.
Products and services
Retail Banking and Wealth Management serves over
900,000 personal customers. We take deposits and
provide transactional banking services to enable
customers to manage their day-to-day finances and save
for the future. We selectively offer credit facilities to
assist customers in their short or longer-term borrowing
requirements, and we provide financial advisory and
investment services to help them to manage their
financial future.
We develop products designed to meet the needs of
specific customer segments, which may include a range
of different services and delivery channels.
Typically, customer offerings include:
– liability-driven services: deposits and account
services;
– asset-driven services: credit and lending, both
secured and unsecured; and
– fee-driven and other services: financial advisory and
asset management.