Kohl's 2014 Annual Report Download - page 16
Download and view the complete annual report
Please find page 16 of the 2014 Kohl's annual report below. You can navigate through the pages in the report by either clicking on the pages listed below, or by using the keyword search tool below to find specific information within the annual report.-
 1
1 -
2
-
3
-
4
-
5
-
 6
6 -
 7
7 -
 8
8 -
 9
9 -
 10
10 -
 11
11 -
 12
12 -
 13
13 -
 14
14 -
 15
15 -
 16
16 -
 17
17 -
 18
18 -
 19
19 -
 20
20 -
 21
21 -
 22
22 -
 23
23 -
 24
24 -
 25
25 -
 26
26 -
27
-
28
-
29
-
30
-
31
-
32
-
33
-
34
-
35
-
36
-
37
-
38
-
39
-
40
-
41
-
42
-
43
-
44
-
45
-
46
-
47
-
48
-
49
-
50
-
51
-
52
-
53
-
54
-
55
-
56
-
57
-
58
-
59
-
60
-
61
-
62
-
63
-
64
-
65
-
66
-
67
-
68
-
69
-
70
-
71
-
72
-
73
-
74
-
75
-
76
-
77
-
78
-
79
-
80
-
81
-
82
 |
 |

Table of Contents
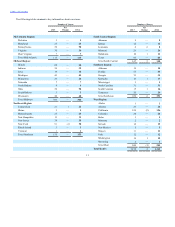
The selected consolidated financial data presented below should be read in conjunction with our consolidated financial statements and related notes
included elsewhere in this document. The Statement of Income and Balance Sheet Data have been derived from our audited consolidated financial
statements.
Net sales
$ 19,031
$ 19,279
$ 18,804
$ 18,391
Cost of merchandise sold
12,087
12,289
11,625
11,359
Gross margin
6,944
6,990
7,179
7,032
Selling, general and administrative expenses
4,313
4,267
4,243
4,190
Depreciation and amortization
889
833
778
750
Operating income
1,742
1,890
2,158
2,092
Interest expense, net
338
329
299
304
Income before income taxes
1,404
1,561
1,859
1,788
Provision for income taxes
515
575
692
668
Net income
$ 889
$ 986
$ 1,167
$ 1,120
Basic earnings per share
$ 4.08
$ 4.19
$ 4.33
$ 3.69
Diluted earnings per share
$ 4.05
$ 4.17
$ 4.30
$ 3.66
Dividends per share
$ 1.40
$ 1.28
$ 1.00
—
Net sales growth
(1.3)%
2.5%
2.2%
7.1%
Comparable sales growth (a)
(1.2)%
0.3%
0.5%
4.4%
Net sales per selling square foot (b)
$ 227
$ 231
$ 232
$ 231
As a percent of sales:
Gross margin
36.5 %
36.3%
38.2%
38.2%
Operating income
9.2 %
9.8%
11.5%
11.4%
Return on average shareholders’ equity (c)
14.8 %
15.8%
16.4%
14.1%
Total square feet of selling space (in thousands)
83,671
83,098
82,226
80,139
Number of stores (end of period)
1,158
1,146
1,127
1,089
Working capital
$ 2,556
$ 2,184
$ 2,222
$ 2,888
Total assets
14,357
13,905
14,148
14,891
Long-term debt
2,792
2,492
2,141
1,894
Capital lease and financing obligations
2,069
2,061
2,103
2,104
Shareholders’ equity
5,978
6,048
6,508
7,850
Cash flow from operations
1,884
1,265
2,139
1,750
Capital expenditures
643
785
927
801
(a) Comparable sales growth is based on sales for stores (including relocated or remodeled stores) which were open throughout both the full current and prior
year periods and omni-channel sales. Fiscal 2013 comparable sales growth compares the 52 weeks ended February 1, 2014 to the 52 weeks ended
January 26, 2013. Fiscal 2012 comparable sales growth compares the 52 weeks ended January 26, 2013 to the 52 weeks ended January 28, 2012.
(b) Net sales per selling square foot includes on-line sales and stores open for the full current period. 2012 excludes the impact of the 53rd week.
(c) Average shareholders’ equity is based on a 5-quarter average.
(d) Fiscal 2012 was a 53-week year. During the 53rd week, total sales were $169 million; selling, general and administrative expenses were approximately
$30 million; interest was approximately $2 million; net income was approximately $15 million and diluted earnings per share was approximately $0.06.
16