Kohl's 2014 Annual Report Download - page 19
Download and view the complete annual report
Please find page 19 of the 2014 Kohl's annual report below. You can navigate through the pages in the report by either clicking on the pages listed below, or by using the keyword search tool below to find specific information within the annual report.-
 1
1 -
2
-
3
-
4
-
5
-
6
-
7
-
8
-
 9
9 -
 10
10 -
 11
11 -
 12
12 -
 13
13 -
 14
14 -
 15
15 -
 16
16 -
 17
17 -
 18
18 -
 19
19 -
 20
20 -
 21
21 -
 22
22 -
 23
23 -
 24
24 -
 25
25 -
 26
26 -
 27
27 -
 28
28 -
 29
29 -
30
-
31
-
32
-
33
-
34
-
35
-
36
-
37
-
38
-
39
-
40
-
41
-
42
-
43
-
44
-
45
-
46
-
47
-
48
-
49
-
50
-
51
-
52
-
53
-
54
-
55
-
56
-
57
-
58
-
59
-
60
-
61
-
62
-
63
-
64
-
65
-
66
-
67
-
68
-
69
-
70
-
71
-
72
-
73
-
74
-
75
-
76
-
77
-
78
-
79
-
80
-
81
-
82
 |
 |

Table of Contents
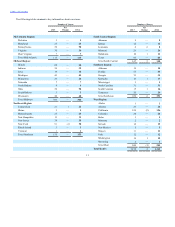
The following table summarizes net sales:
Net sales (In Millions)
$19,031
$19,279
Increase (decrease) in sales:
Total
(1.3)%
2.5%
Comparable (a)
(1.2)%
0.3%
Net sales per selling square foot (b)
$ 227
$ 231
(a) Includes sales for stores (including relocated or remodeled stores) which were open throughout both the full current and prior year periods and
omni-channel sales. 2013 compares the 52 weeks ending February 1, 2014 to the 52 weeks ending January 26, 2013. 2012 compares the 52 weeks
ended January 26, 2013 to the 52 weeks ended January 28, 2012.
(b) Net sales per selling square foot includes on-line sales and stores open for the full current period. 2012 excludes the impact of the 53rd week.
The following table summarizes the changes in net sales:
Net sales - prior year
$ 19,279
Comparable sales (a)
(0.3)%
(233)
(1.2)%
New stores and other revenues
154
—
Net change before 53rd week
(79)
(0.4)%
Net sales in 53rd week
(169)
—
Total decrease in net sales
(248)
(1.3)%
Net sales - current year
$ 19,031
(a) 2013 compares the 52 weeks ending February 1, 2014 to the 52 weeks ending January 26, 2013.
Drivers of the changes in comparable sales were as follows:
Selling price per unit
(0.4)%
Units per transaction
1.5
Average transaction value
1.1
Number of transactions
(2.3)
Comparable sales
(1.2)%
The increase in selling price per unit was primarily due to increases in national brand merchandise penetration. Units per transaction decreased as
customers purchased fewer items in response to the higher prices. Transactions improved throughout the year and were higher in the fourth quarter as the
Greatness Agenda initiatives gained traction.
From a regional perspective, including on-line originated sales, the West, Southeast, and Midwest reported higher sales, which were offset by sales
decreases in the Northeast, Mid-Atlantic, and South Central regions.
By line of business, Children's, Footwear, and Men's reported sales increases. All Children's categories reported sales increases, with toys reporting the
largest increase. Accessories, led by bath and beauty, was slightly above the Company average, primarily as a result of our beauty remodel program. Home
and Women's both underperformed the Company average. Active was the strongest category in the Men's,Women's, and Footwear businesses. Electrics and
luggage reported the highest sales increases in the Home business.
Net sales per selling square foot (which includes on-line sales and stores open for the full current period and includes omni-channel), decreased $1 to
$226 in 2014. The decrease is consistent with the decrease in comparable sales.
19