Kohl's 2014 Annual Report Download - page 20
Download and view the complete annual report
Please find page 20 of the 2014 Kohl's annual report below. You can navigate through the pages in the report by either clicking on the pages listed below, or by using the keyword search tool below to find specific information within the annual report.-
 1
1 -
2
-
3
-
4
-
5
-
6
-
7
-
8
-
9
-
 10
10 -
 11
11 -
 12
12 -
 13
13 -
 14
14 -
 15
15 -
 16
16 -
 17
17 -
 18
18 -
 19
19 -
 20
20 -
 21
21 -
 22
22 -
 23
23 -
 24
24 -
 25
25 -
 26
26 -
 27
27 -
 28
28 -
 29
29 -
 30
30 -
31
-
32
-
33
-
34
-
35
-
36
-
37
-
38
-
39
-
40
-
41
-
42
-
43
-
44
-
45
-
46
-
47
-
48
-
49
-
50
-
51
-
52
-
53
-
54
-
55
-
56
-
57
-
58
-
59
-
60
-
61
-
62
-
63
-
64
-
65
-
66
-
67
-
68
-
69
-
70
-
71
-
72
-
73
-
74
-
75
-
76
-
77
-
78
-
79
-
80
-
81
-
82
 |
 |

Table of Contents
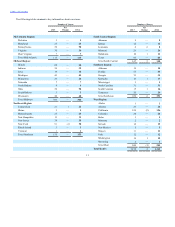
Net sales for 2013 decreased $248 million from 2012 and comparable sales decreased 1.2%. From a line of business perspective, Children's, Men's and
Home outperformed the Company average in 2013. Comparable sales in Women's was consistent with the Company average, while Accessories and Footwear
were below the Company average. All regions, except the West, which reported sales consistent with 2012, reported modest sales decreases.
Gross margin.
Gross margin
$ 6,944
$ 6,990
As a percent of net sales
36.5%
36.3%
Gross margin includes the total cost of products sold, including product development costs, net of vendor payments other than reimbursement of
specific, incremental and identifiable costs; inventory shrink; markdowns; freight expenses associated with moving merchandise from our vendors to our
distribution centers; shipping and handling expenses of on-line sales; and terms cash discount. Our gross margin may not be comparable with that of other
retailers because we include distribution center costs in selling, general and administrative expenses while other retailers may include these expenses in cost
of merchandise sold.
Gross margin as a percentage of sales decreased 8 basis points from 2013 to 2014. Merchandise sales margin increased 9 basis points. Shipping losses
reduced margin 22 basis points more in 2014 than in 2013.
Gross margin as a percentage of sales increased approximately 20 basis points in 2013 over 2012. The increase included a 45 basis point increase in our
merchandise sales margin. This increase was primarily due to modest decreases in apparel costs in 2013. Partially offsetting this increase were higher shipping
losses in our on-line business. The losses were due to higher costs to ship merchandise during the fourth quarter holiday season and to growth in our on-line
business.
Selling, general and administrative expenses.
Selling, general, and administrative expenses
$ 4,313
$ 4,267
As a percent of net sales
22.7%
22.1%
SG&A expenses include compensation and benefit costs (including stores, headquarters, buying and merchandising and distribution centers);
occupancy and operating costs of our retail, distribution and corporate facilities; freight expenses associated with moving merchandise from our distribution
centers to our retail stores and among distribution and retail facilities; advertising expenses, offset by vendor payments for reimbursement of specific,
incremental and identifiable costs; net revenues from our Kohl’s credit card operations; and other administrative revenues and expenses. We do not include
depreciation and amortization in SG&A. The classification of these expenses varies across the retail industry.
The following table summarizes the changes in SG&A by expense type:
Corporate expenses
$ 32
Marketing costs, excluding credit card operations
9
Distribution costs
27
Store expenses
27
Net revenues from credit card operations
(19)
SG&A in 53rd week
(30)
Total increase
$ 46
Many of our expenses, including store payroll and distribution costs, are variable in nature. These costs generally increase as sales increase and
decrease as sales decrease. We measure both the change in these variable expenses and the expense as a percent of sales. If the expense as a percent of sales
decreased from the prior year, the expense "leveraged" and indicates that the expense was well-managed or effectively generated additional sales. If the
expense as a percent of sales
20