McDonalds 2001 Annual Report Download - page 3
Download and view the complete annual report
Please find page 3 of the 2001 McDonalds annual report below. You can navigate through the pages in the report by either clicking on the pages listed below, or by using the keyword search tool below to find specific information within the annual report.-
 1
1 -
 2
2 -
 3
3 -
 4
4 -
 5
5 -
 6
6 -
 7
7 -
 8
8 -
 9
9 -
 10
10 -
 11
11 -
 12
12 -
 13
13 -
 14
14 -
15
-
16
-
17
-
18
-
19
-
20
-
21
-
22
-
23
-
24
-
25
-
26
-
27
-
28
 |
 |

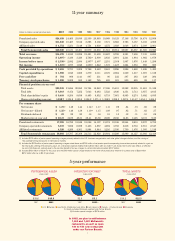
Dollars in millions, except per share data
2001 2000 1999 1998 1997 1996 1995 1994 1993 1992 1991
Franchised sales $24,838 24,463 23,830 22,330 20,863 19,969 19,123 17,146 15,756 14,474 12,959
Company-operated sales $11,040 10,467 9,512 8,895 8,136 7,571 6,863 5,793 5,157 5,103 4,908
Affiliated sales $ 4,752 5,251 5,149 4,754 4,639 4,272 3,928 3,048 2,674 2,308 2,061
Total Systemwide sales $40,630 40,181 38,491 35,979 33,638 31,812 29,914 25,987 23,587 21,885 19,928
Total revenues $14,870 14,243 13,259 12,421 11,409 10,687 9,795 8,321 7,408 7,133 6,695
Operating income $ 2,697(1) 3,330 3,320 2,762(3) 2,808 2,633 2,601 2,241 1,984 1,862 1,679
Income before taxes $ 2,330(2) 2,882 2,884 2,307(3) 2,407 2,251 2,169 1,887 1,676 1,448 1,299
Net income $ 1,637(2) 1,977 1,948 1,550(3) 1,642 1,573 1,427 1,224 1,083 959 860
Cash provided by operations $ 2,688 2,751 3,009 2,766 2,442 2,461 2,296 1,926 1,680 1,426 1,423
Capital expenditures $ 1,906 1,945 1,868 1,879 2,111 2,375 2,064 1,539 1,317 1,087 1,129
Free cash flow $ 782 806 1,141 887 331 86 232 387 363 339 294
Treasury stock purchases $ 1,090 2,002 933 1,162 765 605 321 500 628 92 117
Financial position at year end
Total assets $22,535 21,684 20,983 19,784 18,242 17,386 15,415 13,592 12,035 11,681 11,349
Total debt $ 8,918 8,474 7,252 7,043 6,463 5,523 4,836 4,351 3,713 3,857 4,615
Total shareholders’ equity $ 9,488 9,204 9,639 9,465 8,852 8,718 7,861 6,885 6,274 5,892 4,835
Shares outstanding
IN MILLIONS
1,280.7 1,304.9 1,350.8 1,356.2 1,371.4 1,389.2 1,399.5 1,387.4 1,414.7 1,454.1 1,434.5
Per common share
Net income $ 1.27(2) 1.49 1.44 1.14(3) 1.17 1.11 .99 .84 .73 .65 .59
Net income–diluted $ 1.25(2) 1.46 1.39 1.10(3) 1.15 1.08 .97 .82 .71 .63 .57
Dividends declared $ .23 .22 .20 .18 .16 .15 .13 .12 .11 .10 .09
Market price at year end $ 26.47 34.00 40.31 38.41 23.88 22.69 22.56 14.63 14.25 12.19 9.50
Franchised restaurants 17,395 16,795 15,949 15,086 14,197 13,374 12,186 10,944 9,918 9,237 8,735
Company-operated restaurants 8,378 7,652 6,059 5,433 4,887 4,294 3,783 3,216 2,733 2,551 2,547
Affiliated restaurants 4,320 4,260 4,301 3,994 3,844 3,216 2,330 1,739 1,476 1,305 1,136
Total Systemwide restaurants
30,093 28,707 26,309 24,513 22,928 20,884 18,299 15,899 14,127 13,093 12,418
(1) Includes $378 million of pretax special operating charges primarily related to the U.S. business reorganization and other global change initiatives, and the closing of
163 underperforming restaurants in international markets.
(2) Includes the $378 million of pretax special operating charges noted above and $125 million of net pretax special nonoperating income items primarily related to a gain on
the initial public offering of McDonald’s Japan, for a net pretax expense of $253 million ($143 million after tax or $0.11 per share). Net income also reflects an effective
tax rate of 29.8 percent, primarily due to the one-time benefit of tax law changes in certain international markets ($147 million).
(3) Includes $162 million of Made For You costs and the $160 million special charge related to the home office productivity initiative for a pretax total of $322 million
($219 million after tax or $0.16 per share).
11-year summary
In 2002, we plan to add between
1,300 and 1,400 McDonald’s
restaurants, as well as open
100 to 150 new restaurants
under our Partner Brands.
1
5-year performance
1997 1997 2001
(2)
$33.6 $2.8 $18.2
SYSTEMWIDE SALES
IN BILLIONS
OPERATING INCOME(1)
IN BILLIONS
TOTAL ASSETS
IN BILLIONS
$40.6 $3.1 $22.5
1997 2001
U.S. Europe Asia/Pacific, Middle East and Africa Latin America Canada Partner Brands Corporate
(1) Graph excludes Corporate segment and Partner Brands.
(2) Excludes special charges of $378 million.
2001