McDonalds 2003 Annual Report Download - page 2
Download and view the complete annual report
Please find page 2 of the 2003 McDonalds annual report below. You can navigate through the pages in the report by either clicking on the pages listed below, or by using the keyword search tool below to find specific information within the annual report.-
 1
1 -
 2
2 -
 3
3 -
 4
4 -
 5
5 -
 6
6 -
 7
7 -
 8
8 -
 9
9 -
 10
10 -
 11
11 -
 12
12 -
 13
13 -
14
-
15
-
16
-
17
-
18
-
19
-
20
-
21
-
22
-
23
-
24
-
25
-
26
-
27
-
28
 |
 |
Contents
11- year summary
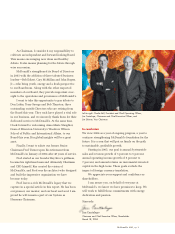
1Letter to shareholders
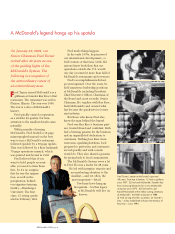
4A McDonald’s legend hangs up his spatula
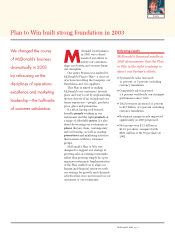
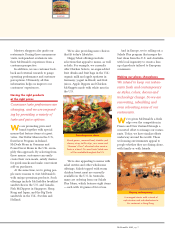
5Plan to Win built strong foundation in 2003
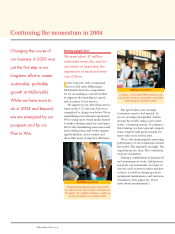
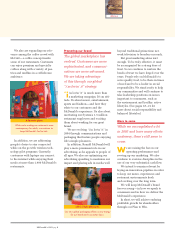
6Continuing the momentum in 2004
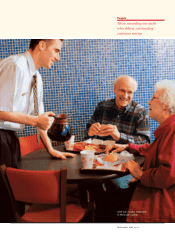
14 Measuring performance for a better customer experience
18 Partnering with our suppliers
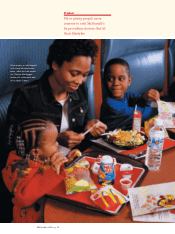
20 Living a balanced lifestyle
22 Directors & corporate officers
23 Investor information & services
24 A helping hand
(1) Includes pretax charges (substantially all noncash) of $408 million ($323 million after tax or $0.25 per share) primarily related to the disposition of certain
non-McDonald’s brands and asset/goodwill impairment.
(2) Includes pretax charges of $853 million ($700 million after tax or $0.55 per share) primarily related to restructuring certain international markets and eliminating
positions, restaurant closings/asset impairment and the write-off of technology costs. (The cash portion of these charges was approximately $100 million after tax.)
(3) Includes pretax operating charges of $378 million primarily related to the U.S. business reorganization and other global change initiatives, and restaurant closings/asset
impairment as well as net pretax nonoperating income of $125 million primarily related to a gain on the initial public offering of McDonald’s Japan, for a total pretax
expense of $253 million ($143 million after tax or $0.11 per share). (The cash portion of this net expense was approximately $100 million after tax.) Net income also
reflects an effective tax rate of 29.8 percent, primarily due to the benefit of tax law changes in certain international markets ($147 million).
(4) Includes pretax charges of $322 million ($219 million after tax or $0.16 per share) consisting of $162 million of Made For You costs and $160 million related to a home
office productivity initiative.
(5) Includes a $37 million after-tax charge ($0.03 per share) to reflect the cumulative effect of the adoption of SFAS No. 143 “Accounting for Asset Retirement Obligations,”
which requires legal obligations associated with the retirement of long-lived assets to be recognized at their fair value at the time the obligations are incurred.
(6) Includes a $99 million after-tax charge ($0.08 per share–basic and $0.07 per share–diluted) to reflect the cumulative effect of the adoption of SFAS No. 142 “Goodwill
and Other Intangible Assets,” which eliminates the amortization of goodwill and instead subjects it to annual impairment tests. Adjusted for the nonamortization provi-
sions of SFAS No. 142, net income per common share would have been $0.02 higher in 2001 and 2000 and $0.01 higher in 1996–1999.
(7) While franchised and affiliated sales are not recorded as revenues by the Company, management believes they are important in understanding the Company’s financial
performance because these sales are the basis on which the Company calculates and records franchised and affiliated revenues and are indicative of the financial health
of the franchisee base.
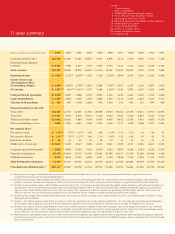
11- year summary
Dollars in millions, except per share data 2003 2002 2001 2000 1999 1998 1997 1996 1995 1994 1993
Company-operated sales $12,795 11,500 11,041 10,467 9,512 8,895 8,136 7,571 6,863 5,793 5,157
Franchised and affiliated
revenues $4,345 3,906 3,829 3,776 3,747 3,526 3,273 3,116 2,932 2,528 2,251
Total revenues $17,140 15,406 14,870 14,243 13,259 12,421 11,409 10,687 9,795 8,321 7,408
Operating income $ 2,832(1) 2,113(2) 2,697(3) 3,330 3,320 2,762(4) 2,808 2,633 2,601 2,241 1,984
Income before taxes
and cumulative effect
of accounting changes $ 2,346(1) 1,662(2) 2,330(3) 2,882 2,884 2,307(4) 2,407 2,251 2,169 1,887 1,676
Net income $ 1,471(1,5) 893(2,6) 1,637(3) 1,977 1,948 1,550(4) 1,642 1,573 1,427 1,224 1,083
Cash provided by operations $ 3,269 2,890 2,688 2,751 3,009 2,766 2,442 2,461 2,296 1,926 1,680
Capital expenditures $ 1,307 2,004 1,906 1,945 1,868 1,879 2,111 2,375 2,064 1,539 1,317
Treasury stock purchases $ 439 687 1,090 2,002 933 1,162 765 605 321 500 628
Financial position at year end:
Total assets $25,525 23,971 22,535 21,684 20,983 19,784 18,242 17,386 15,415 13,592 12,035
Total debt $9,731 9,979 8,918 8,474 7,252 7,043 6,463 5,523 4,836 4,351 3,713
Total shareholders’ equity $11,982 10,281 9,488 9,204 9,639 9,465 8,852 8,718 7,861 6,885 6,274
Shares outstanding in millions 1,262 1,268 1,281 1,305 1,351 1,356 1,371 1,389 1,400 1,387 1,415
Per common share:
Net income–basic $1.16(1,5) .70(2,6) 1.27(3) 1.49 1.44 1.14(4) 1.17 1.11 .99 .84 .73
Net income–diluted $1.15(1,5) .70(2,6) 1.25(3) 1.46 1.39 1.10(4) 1.15 1.08 .97 .82 .71
Dividends declared $.40 .24 .23 .22 .20 .18 .16 .15 .13 .12 .11
Market price at year end $24.83 16.08 26.47 34.00 40.31 38.41 23.88 22.69 22.56 14.63 14.25
Company-operated restaurants 8,959 9,000 8,378 7,652 6,059 5,433 4,887 4,294 3,783 3,216 2,733
Franchised restaurants 18,132 17,864 17,395 16,795 15,949 15,086 14,197 13,374 12,186 10,944 9,918
Affiliated restaurants 4,038 4,244 4,320 4,260 4,301 3,994 3,844 3,216 2,330 1,739 1,476
Total Systemwide restaurants 31,129 31,108 30,093 28,707 26,309 24,513 22,928 20,884 18,299 15,899 14,127
Franchised and affiliated sales(7) $33,137 30,026 29,590 29,714 28,979 27,084 25,502 24,241 23,051 20,194 18,430