Regions Bank 2013 Annual Report Download - page 11
Download and view the complete annual report
Please find page 11 of the 2013 Regions Bank annual report below. You can navigate through the pages in the report by either clicking on the pages listed below, or by using the keyword search tool below to find specific information within the annual report.-
 1
1 -
 2
2 -
 3
3 -
 4
4 -
 5
5 -
 6
6 -
 7
7 -
 8
8 -
 9
9 -
 10
10 -
 11
11 -
 12
12 -
 13
13 -
 14
14 -
 15
15 -
 16
16 -
 17
17 -
 18
18 -
 19
19 -
 20
20
 |
 |

REGIONS 2013 YEAR IN REVIEW 9
By nearly every measure, our 2013 results were positive.
We grew loans, households and accounts — many of
these metrics for the first time in several years. Fifteen of
our 17 businesses expanded. Credit quality improved
markedly. We prudently managed expenses while making
appropriate investments in technology and talent to support
continued growth. And customer satisfaction continued
to rise. With a business strategy built on a foundation of
creating shared value for all of our stakeholder groups, we
were able to deliver a solid profit by offering customers the
financial products and services they need to help them
reach their financial goals.
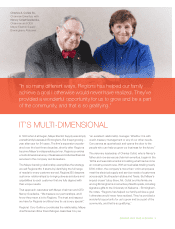
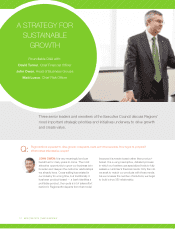
Creating Shared Value — A Foundational Strategy
Over one year ago, as Regions progressed through a
recovery period, our Board and leadership team began to
think carefully about a new foundational business strategy.
The foundation that emerged from that process — creating
shared value — calls for our actions to benefit all stakehold-
ers. We firmly believe that the most powerful way to create
long-term value for Regions’ shareholders and opportunity
for our associates is to ensure that our customers and
communities are prospering as well. We believe the
sequence of the decision-making process is critical, which
is why each choice we make begins with our customers.
In 2013, we made continued progress in implementing
the shared value strategy across the organization, which
contributed in a meaningful way to our positive results during
the year. Our approach requires us to think holistically about
our customers’ full range of needs, and to match solutions
to those needs in a manner that creates value for both
participants in the relationship.
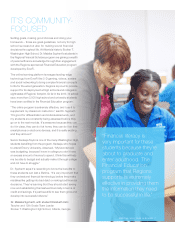
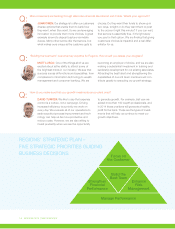
Regions360: How We Create Shared Value
Regions360 — which is a detailed, prescriptive approach
that empowers our bankers to create deeper and broader
relationships with our customers — exemplifies how we
create shared value. We introduced this approach because
we understand that every customer has unique needs and
can benefit from our broad range of products and services.
At the same time, the financial needs of our customers in
our three segments, consumer, commercial and wealth,
are diverse. For example, a young family with a checking
account needs to invest for college and retirement. A
commercial customer with a business loan needs to manage
cash and receivables. A wealth client with a teenager in
college needs joint checking with the flexibility to manage
funds anywhere, anytime, via mobile. Taken as a whole
across the 16 states we serve, these varying needs
represent an important opportunity for sustainable growth
in the years ahead.
As part of the Regions360 introduction, we provide
extensive training and tools so our associates are consistent
in how they use the approach with each customer. This is a
strategy that works from the inside out, with the customer
in the center, and enables us to identify financial needs rel-
evant to all aspects of their lives or business activities. Only
after that work is completed do we match those needs with
Regions solutions that are suitable for the customer and that
provide the bank a fair value of exchange for the services we
provide. While we are still in the process of implementing
Regions360 across the full organization, we have already
seen how impactful it can be in building value for both the
bank and our customers.
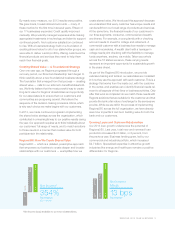
Growing Loans and Customer Relationships
Our 2013 loan growth underscores the potential of
Regions360. Last year, total new and renewed loan
production increased $4.5 billion, or 8 percent, from
the previous year. Business lending grew, led by our
commercial and industrial portfolio, which increased
$2.7 billion. Specialized expertise in attractive growth
industries like energy and healthcare remains a positive
differentiator for Regions.
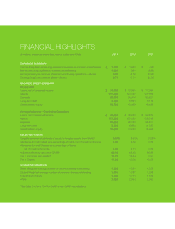
Net Income*
$1,090
$991
$(429)2011
2012
2013
354%
Increase
($ in millions)
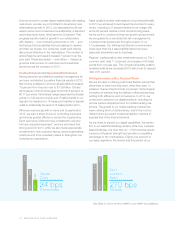
Net Interest
Margin
3.20%
3.11%
3.07%2011
2012
2013
13 bps
Increase
*Net Income (loss) available to common shareholders.