Regions Bank 2013 Annual Report Download - page 12
Download and view the complete annual report
Please find page 12 of the 2013 Regions Bank annual report below. You can navigate through the pages in the report by either clicking on the pages listed below, or by using the keyword search tool below to find specific information within the annual report.-
 1
1 -
 2
2 -
 3
3 -
 4
4 -
 5
5 -
 6
6 -
 7
7 -
 8
8 -
 9
9 -
 10
10 -
 11
11 -
 12
12 -
 13
13 -
 14
14 -
 15
15 -
 16
16 -
 17
17 -
 18
18 -
 19
19 -
 20
20
 |
 |

10 REGIONS 2013 YEAR IN REVIEW
Even as we work to create deeper relationships with existing
customers, we also are committed to developing new
relationships as well. In 2013, our associates found new
ways to serve more consumers more effectively. A standout
was indirect auto loans, which grew by 32 percent. That
progress was the result of growth in our collaboration
with dealers — now numbering more than 2,100 — and
technology that accelerates loan processing for dealers
and their car buyers. Our consumer credit card offering
also proved attractive in the marketplace. The number of
active Regions card users increased 7 percent over the
prior year. These successes — and others — helped us
grow the total number of customers and households
served across the company in 2013.
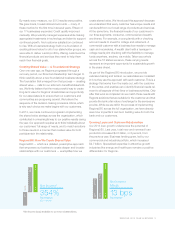
Positive Financial and Operational Performance
Strong execution and effective expense management by
our team contributed to positive financial results in 2013.
Net income available to common shareholders increased
10 percent from the prior year to $1.09 billion. Diluted
earnings per common share grew more than 8 percent, to
$0.77 per share. Net interest margin expanded by 9 basis
points, to 3.20 percent at year-end. Positive trends in our
deposit mix resulted in a 15 basis point decline in deposit
costs to a historically low level of 15 basis points in 2013.
While we restored growth in loans and households in
2013, we kept a sharp focus on controlling expenses
and driving greater efficiency across the organization.
Each year since 2009 we have consistently reduced
full-year adjusted expenses*, and we extended that
strong record in 2013, while we also made appropriate
investments in new customer-facing, revenue-generating
positions and took necessary steps to strengthen our
compliance organization.
Asset quality is another vital measure of our financial health.
In 2013 we achieved broad-based improvement in every
metric, including a 31 percent decline in net charge-offs
and a 36 percent decline in total nonperforming loans.
As we work to continue driving loan growth going forward,
we are guided by a mandate that risk management is
a fundamental requirement throughout each of our
17 businesses. Our training and internal communication
make clear that it is a responsibility shared by every
associate everywhere we do business.
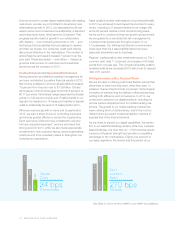
Regions’ capital position also remains strong as our Tier 1
common ratio* was 11.2 percent, an increase of 40 basis
points from one year ago. The company’s liquidity position
remained solid as we concluded 2013 with a loan-to-deposit
ratio of 81 percent.
Driving Innovation with a Personal Touch
We are focused on offering customers flexible options that
allow them to bank how they want, when they want, in
whatever manner they find most convenient. Technological
innovation is transforming the delivery of financial services,
adding both efficiency and convenience. In 2013, we
continued to enhance our digital solutions, including our
remote capture deposit product for mobile banking cus-
tomers. The growth in our mobile banking channel has
been nothing short of extraordinary, and in the not-too-
distant future we expect mobile transaction volumes to
surpass that of the Internet channel.
As we invest to expand our digital capabilities, we remain
firm in our belief that banking remains, at its core, a people-
based business. It is clear that our 1,705 branches remain
a source of Regions’ strength and provide a competitive
advantage in the marketplace. Eighty-one percent of
our sales originate in the branch and 64 percent of our
11.2%
10.8%
8.5%2011
2012
2013
Tier 1
Common
Ratio*
270 bps
Increase
0.15%
0.30%
0.49%2011
2012
2013
Deposit
Costs
34 bps
Improvement
*See Table 2 in Form 10-K for GAAP to non-GAAP reconciliations.