Starbucks 1999 Annual Report Download - page 12
Download and view the complete annual report
Please find page 12 of the 1999 Starbucks annual report below. You can navigate through the pages in the report by either clicking on the pages listed below, or by using the keyword search tool below to find specific information within the annual report.-
 1
1 -
 2
2 -
 3
3 -
 4
4 -
 5
5 -
 6
6 -
 7
7 -
 8
8 -
 9
9 -
 10
10 -
 11
11 -
 12
12 -
 13
13 -
 14
14 -
 15
15 -
 16
16 -
 17
17 -
 18
18 -
 19
19 -
 20
20 -
 21
21 -
 22
22 -
23
-
24
-
25
-
26
-
27
-
28
-
29
-
30
-
31
-
32
 |
 |

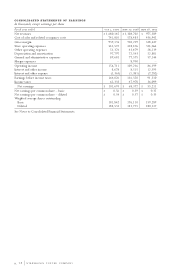
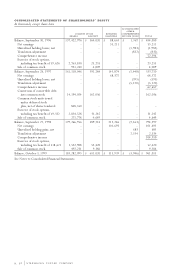
CONSOLIDATED STATEMENTS OF EARNINGS
In thousands, except earnings per share
Fiscal year ended , , ,
Net revenues $ 1,680,145 $ 1,308,702 $ 975,389
Cost of sales and related occupancy costs 741,010 578,483 436,942
Gross margin 939,135 730,219 538,447
Store operating expenses 543,572 418,476 314,064
Other operating expenses 51,374 43,479 28,239
Depreciation and amortization 97,797 72,543 52,801
General and administrative expenses 89,681 77,575 57,144
Merger expenses – 8,930 –
Operating income 156,711 109,216 86,199
Interest and other income 8,678 8,515 12,393
Interest and other expense (1,363) (1,381) (7,282)
Earnings before income taxes 164,026 116,350 91,310
Income taxes 62,333 47,978 36,099
Net earnings $ 101,693 $ 68,372 $ 55,211
Net earnings per common share – basic $ 0.56 $ 0.39 $ 0.35
Net earnings per common share – diluted $ 0.54 $ 0.37 $ 0.33
Weighted average shares outstanding
Basic 181,842 176,110 159,289
Diluted 188,531 183,771 180,317
See Notes to Consolidated Financial Statements.
. STARBUCKS COFFEE COMPANY