Starbucks 1999 Annual Report Download - page 28
Download and view the complete annual report
Please find page 28 of the 1999 Starbucks annual report below. You can navigate through the pages in the report by either clicking on the pages listed below, or by using the keyword search tool below to find specific information within the annual report.-
 1
1 -
2
-
3
-
4
-
5
-
6
-
7
-
8
-
9
-
10
-
11
-
12
-
13
-
14
-
15
-
16
-
17
-
 18
18 -
 19
19 -
 20
20 -
 21
21 -
 22
22 -
 23
23 -
 24
24 -
 25
25 -
 26
26 -
 27
27 -
 28
28 -
 29
29 -
 30
30 -
 31
31 -
 32
32
 |
 |

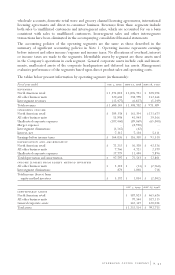
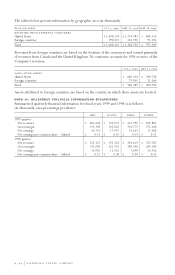
The tables below present information by geographic area (in thousands):
Fiscal year ended , , ,
United States $ 1,490,133 $ 1,173,982 $ 884,314
Foreign countries 190,012 134,720 91,075
Total $ 1,680,145 $ 1,308,702 $ 975,389
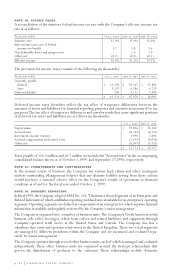
Revenues from foreign countries are based on the location of the customers and consist primarily
of revenues from Canada and the United Kingdom. No customer accounts for 10% or more of the
Company’s revenues.
, ,
-
United States $ 680,344 $ 549,730
Foreign countries 79,945 51,064
Total $ 760,289 $ 600,794
Assets attributed to foreign countries are based on the country in which those assets are located.
NOTE 15: QUARTERLY FINANCIAL INFORMATION (UNAUDITED)
Summarized quarterly financial information for fiscal years 1999 and 1998 is as follows
(in thousands, except earnings per share):
1999 quarter
Net revenues $ 405,638 $ 375,822 $ 423,792 $ 474,893
Gross margin 219,338 205,865 238,772 275,160
Net earnings 26,733 17,957 24,635 32,368
Net earnings per common share – diluted $ 0.14 $ 0.10 $ 0.13 $ 0.17
1998 quarter
Net revenues $ 321,325 $ 295,243 $ 334,429 $ 357,705
Gross margin 175,090 161,742 189,348 204,039
Net earnings 20,955 13,962 7,899 25,556
Net earnings per common share – diluted $ 0.12 $ 0.08 $ 0.04 $ 0.14
. STARBUCKS COFFEE COMPANY