Starbucks 1999 Annual Report Download - page 7
Download and view the complete annual report
Please find page 7 of the 1999 Starbucks annual report below. You can navigate through the pages in the report by either clicking on the pages listed below, or by using the keyword search tool below to find specific information within the annual report.-
 1
1 -
 2
2 -
 3
3 -
 4
4 -
 5
5 -
 6
6 -
 7
7 -
 8
8 -
 9
9 -
 10
10 -
 11
11 -
 12
12 -
 13
13 -
 14
14 -
 15
15 -
 16
16 -
 17
17 -
 18
18 -
19
-
20
-
21
-
22
-
23
-
24
-
25
-
26
-
27
-
28
-
29
-
30
-
31
-
32
 |
 |

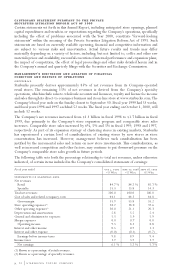
Gross margin increased to 55.8% for fiscal 1998 compared to 55.2% for fiscal 1997.This increase
was primarily the result of prior year sales price increases partially offset by higher green coffee costs.
Store operating expenses as a percentage of retail sales increased to 38.0% for fiscal 1998 from
37.6% for fiscal 1997.This was due to integration costs associated with the Transaction. Excluding
these costs, store operating expenses for fiscal 1998 would have been 37.5% of retail sales.
Other operating expenses (expenses associated with the Company’s specialty operations, as well
as the Company’s share of joint venture profits and losses) increased to 21.1% of specialty
revenues for fiscal 1998 from 20.3% for fiscal 1997. The increase was attributable to higher
advertising expenses and higher payroll-related costs for the Company’s international and grocery
businesses, partially offset by improved results of both the North American Coffee Partnership and
the Ice Cream Joint Venture.
Merger expenses of $8.9 million consisted mainly of investment banking, legal and accounting fees.
Interest and other income for fiscal 1998 was $8.5 million, compared to $12.4 million for fiscal
1997.The decrease was primarily due to lower average investment balances.
Interest and other expense for fiscal 1998 was $1.4 million compared to $7.3 million for fiscal
1997.The decrease was due to the conversion of the Company’s $165.0 million 41
/4% Convertible
Subordinated Debentures to common stock during the first quarter of fiscal 1998.
The Company’s effective tax rate for fiscal 1998 was 41.2% compared to 39.5% in fiscal 1997.
The effective tax rate in both years was impacted by non-deductible losses of Seattle Coffee
Company prior to the Transaction. Fiscal 1998’s rate was also affected by Transaction-related costs.
Excluding the impact of Transaction-related costs, the effective tax rate for fiscal 1998 would have
been 38.3%.
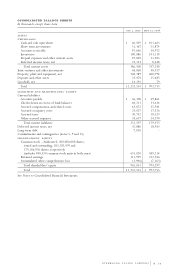
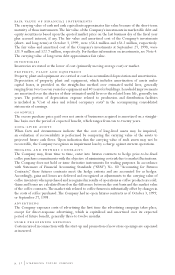
LIQUIDITY AND CAPITAL RESOURCES
The Company ended fiscal 1999 with $117.8 million in total cash and short-term investments.
Working capital as of October 3, 1999, totaled $134.9 million compared to $157.8 million
at September 27, 1998. Cash and cash equivalents decreased by $35.2 million during fiscal 1999
to $66.4 million at October 3, 1999. This decrease was offset by an increase in short-term
investments of $29.5 million during the same period.
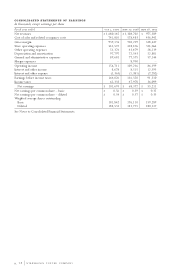
Cash provided by operating activities for fiscal 1999 totaled $210.6 million and resulted primarily
from net earnings before non-cash charges of $210.1 million.
Cash used by investing activities for fiscal 1999 totaled $336.3 million. This included capital
additions to property, plant and equipment of $261.8 million related to opening 460 new
Company-operated retail stores and remodeling certain existing stores, purchasing roasting and
packaging equipment for the Company’s roasting and distribution facilities, enhancing information
systems and expanding existing office space.The purchases of Pasqua and Tazo used $15.7 million.
During fiscal 1999, the Company made equity investments of $10.5 million in its international
joint ventures. The Company received $5.7 million in distributions from the North American
Coffee Partnership and $3.3 million in distributions from the Ice Cream Joint Venture. The
Company also used $28.3 million to make minority investments in Living.com, Inc. and Talk City,
Inc. The Company invested excess cash primarily in short-term, investment-grade marketable
debt securities. The net activity in the Company’s marketable securities portfolio during fiscal
1999 provided $34.1 million.
.
STARBUCKS COFFEE COMPANY