Starbucks 1999 Annual Report Download - page 6
Download and view the complete annual report
Please find page 6 of the 1999 Starbucks annual report below. You can navigate through the pages in the report by either clicking on the pages listed below, or by using the keyword search tool below to find specific information within the annual report.-
 1
1 -
 2
2 -
 3
3 -
 4
4 -
 5
5 -
 6
6 -
 7
7 -
 8
8 -
 9
9 -
 10
10 -
 11
11 -
 12
12 -
 13
13 -
 14
14 -
 15
15 -
 16
16 -
 17
17 -
18
-
19
-
20
-
21
-
22
-
23
-
24
-
25
-
26
-
27
-
28
-
29
-
30
-
31
-
32
 |
 |

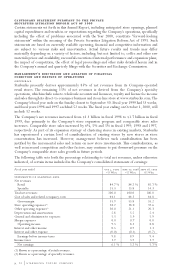
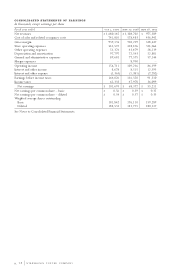
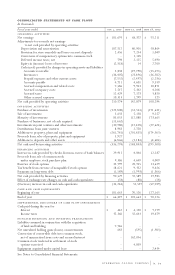
Store operating expenses as a percentage of retail sales increased to 38.2% for fiscal 1999 from
37.5% for fiscal 1998, excluding costs associated with the Transaction.This was due primarily to
higher payroll-related expenditures resulting from both an increase in average hourly wage rates
and a continuing shift in sales to handcrafted beverages, which are more labor intensive. Including
the Transaction costs, store operating expenses for fiscal 1998 were 38.0% of retail sales.
Other operating expenses (expenses associated with all operations other than Company-owned
retail stores, including the Company’s share of joint venture profits and losses) were 20.0% of
specialty revenues during fiscal 1999, compared to 21.1% for fiscal 1998. This decrease was
attributable to lower operating expenses associated with the grocery channel after the transition
to Kraft, partially offset by higher payroll expense supporting other channels.
Depreciation and amortization was 5.8% of net revenues, up from 5.5% of net revenues for fiscal
1998, primarily due to depreciation on new information systems put into service in late fiscal
1998 and during fiscal 1999. General and administrative expenses were 5.3% of net revenues
during fiscal 1999 compared to 5.9% for fiscal 1998, primarily due to proportionately lower
payroll-related expenses.
The Company’s effective tax rate for fiscal 1999 was 38.0% compared to 41.2% for fiscal 1998.
The effective tax rate in fiscal 1998 was impacted by non-deductible losses of Seattle Coffee
Company prior to the Transaction. Fiscal 1998’s rate was also affected by Transaction-related costs.
Management expects the effective tax rate to be approximately 38% during fiscal 2000.
RESULTS OF OPERATIONS – FISCAL 1998 COMPARED TO FISCAL 1997
Net revenues increased 34% to $1.3 billion for fiscal 1998, compared to $975 million for fiscal
1997. Retail sales increased 32% to $1.1 billion from $836 million.The increase in retail sales was
due primarily to the addition of new Company-operated stores. In addition, comparable store
sales increased 5% for the 52 weeks ended September 27, 1998 compared to the same 52-week
period in fiscal 1997. Comparable store sales increases resulted from an increase in the number of
transactions combined with an increase in the average dollar value per transaction.The increase in
average dollar value per transaction was primarily due to the sales price increases effected during
fiscal 1997. During fiscal 1998, the Company opened 357 stores in continental North America and
37 stores in the United Kingdom. By fiscal year-end, there were 1,622 Company-operated stores
in continental North America and 66 in the United Kingdom.
Specialty revenues increased 48% to $206 million for fiscal 1998 from $139 million for fiscal
1997.The increase was due primarily to increased sales and license fees in the grocery category,
increased sales to the Company’s joint ventures and licensees and higher wholesale club sales.
The Company sells roasted coffee to its joint venture with Pepsi-Cola Company, a division of
PepsiCo, Inc. (the “North American Coffee Partnership”), for use in the manufacture of its bottled
Frappuccino®coffee drink. The Company also sells coffee extract to Dreyer’s Grand Ice
Cream, Inc. (“Dreyer’s”) for use in the manufacture of Starbucks branded ice creams sold by the
Company’s joint venture with Dreyer’s (the “Ice Cream Joint Venture”). Licensees (including those
in which the Company is a joint venture partner) opened 45 stores in continental North America
and 48 stores in international markets.The Company ended the year with 133 licensed stores in
continental North America and 65 licensed stores in international markets.
. STARBUCKS COFFEE COMPANY