Starbucks 2007 Annual Report Download - page 5
Download and view the complete annual report
Please find page 5 of the 2007 Starbucks annual report below. You can navigate through the pages in the report by either clicking on the pages listed below, or by using the keyword search tool below to find specific information within the annual report.-
 1
1 -
 2
2 -
 3
3 -
 4
4 -
 5
5 -
 6
6 -
 7
7 -
 8
8 -
 9
9 -
 10
10 -
 11
11 -
 12
12 -
 13
13 -
 14
14 -
 15
15 -
 16
16 -
17
-
18
-
19
-
20
-
21
-
22
-
23
-
24
-
25
-
26
-
27
-
28
-
29
-
30
-
31
-
32
-
33
-
34
-
35
-
36
-
37
-
38
-
39
-
40
-
41
-
42
-
43
-
44
-
45
-
46
-
47
-
48
-
49
-
50
-
51
-
52
-
53
-
54
-
55
-
56
-
57
-
58
-
59
-
60
-
61
-
62
-
63
-
64
-
65
-
66
-
67
-
68
-
69
-
70
-
71
-
72
-
73
-
74
-
75
-
76
-
77
-
78
-
79
-
80
-
81
-
82
-
83
 |
 |

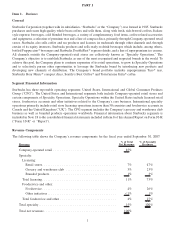
coffee beverages, a limited selection of whole bean coffees and a few accessories such as travel tumblers and logo
mugs. A selection of prepared sandwiches and salads were carried in approximately 4,800 United States and 1,600
International stores, at the end of fiscal 2007. Starbucks continues to expand its food warming program in the United
States, with over 3,000 stores as of September 30, 2007 providing warm food items, primarily breakfast sandwiches.
The Company’s retail sales mix by product type was as follows for the periods indicated:
Fiscal Year Ended Sept 30, 2007 Oct 1, 2006 Oct 2, 2005
Beverages ...................................... 75% 77% 77%
Food.......................................... 17% 15% 15%
Coffee-making equipment and other merchandise ......... 5% 5% 4%
Whole bean coffees ............................... 3% 3% 4%
Total .......................................... 100% 100% 100%
Specialty Operations
Specialty Operations strive to develop the Company’s brands outside the Company-operated retail store environ-
ment through a number of channels. Starbucks strategy is to reach customers where they work, travel, shop and dine
by establishing relationships with prominent third parties that share the Company’s values and commitment to
quality. These relationships take various forms, including licensing arrangements, foodservice accounts and other
initiatives related to the Company’s core businesses. In certain situations, Starbucks has an equity ownership
interest in licensee operations. During fiscal 2007, specialty revenues (which include royalties and fees from
licensees, as well as product sales derived from Specialty Operations) accounted for 15% of total net revenues.
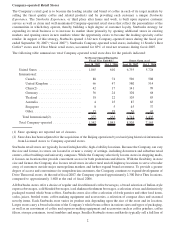
Licensing — Retail stores
In its licensed retail store operations, the Company leverages the expertise of its local partners and shares Starbucks
operating and store development experience. Licensee partners provide improved and, at times, the only access to
desirable retail space. Most licensees are prominent retailers with in-depth market knowledge and access. As part of
these arrangements, Starbucks receives license fees and royalties and sells coffee, tea, compact discs and related
products for resale in licensed locations. Employees working in licensed retail locations are required to follow
Starbucks detailed store operating procedures and attend training classes similar to those given to employees in
Company-operated stores.
During fiscal 2007, 723 Starbucks licensed retail stores were opened in the United States and, as of September 30,
2007, the Company’s U.S. licensees operated 3,891 stores. During fiscal 2007, 506 International licensed stores
were opened. At September 30, 2007, the Company’s International operating segment had a total of 2,615 licensed
retail stores. Product sales to and royalty and license fee revenues from U.S. and International licensed retail stores
accounted for 47% of specialty revenues in fiscal 2007.
At fiscal year end 2007, Starbucks total licensed retail stores by region and specific location were as follows:
Asia Pacific Europe/Middle East/Africa Americas
Japan................ 722 Turkey ............... 82 United States .......... 3,891
South Korea .......... 215 Spain................ 68 Canada .............. 234
China ............... 212 Greece............... 64 Mexico .............. 159
Taiwan .............. 209 Saudi Arabia .......... 58 Other ................ 26
Philippines............ 119 Kuwait .............. 49
Malaysia ............. 92 United Arab Emirates . . . 47
Indonesia ............. 58 France ............... 37
New Zealand .......... 45 Switzerland ........... 35
Other ................ 84
Total ................ 1,672 Total ................ 524 Total ................ 4,310
3