Starbucks 2007 Annual Report Download - page 58
Download and view the complete annual report
Please find page 58 of the 2007 Starbucks annual report below. You can navigate through the pages in the report by either clicking on the pages listed below, or by using the keyword search tool below to find specific information within the annual report.-
 1
1 -
2
-
3
-
4
-
5
-
6
-
7
-
8
-
9
-
10
-
11
-
12
-
13
-
14
-
15
-
16
-
17
-
18
-
19
-
20
-
21
-
22
-
23
-
24
-
25
-
26
-
27
-
28
-
29
-
30
-
31
-
32
-
33
-
34
-
35
-
36
-
37
-
38
-
39
-
40
-
41
-
42
-
43
-
44
-
45
-
46
-
47
-
 48
48 -
 49
49 -
 50
50 -
 51
51 -
 52
52 -
 53
53 -
 54
54 -
 55
55 -
 56
56 -
 57
57 -
 58
58 -
 59
59 -
 60
60 -
 61
61 -
 62
62 -
 63
63 -
 64
64 -
 65
65 -
 66
66 -
 67
67 -
 68
68 -
69
-
70
-
71
-
72
-
73
-
74
-
75
-
76
-
77
-
78
-
79
-
80
-
81
-
82
-
83
 |
 |

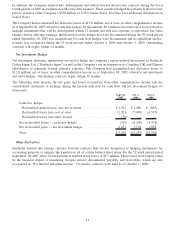
Note 7: Property, Plant and Equipment
Property, plant and equipment are recorded at cost and consist of the following (in thousands):
Fiscal Year Ended Sept 30, 2007 Oct 1, 2006
Land .................................................. $ 56,238 $ 32,350
Buildings .............................................. 161,730 109,129
Leasehold improvements ................................... 3,103,121 2,436,503
Store equipment ......................................... 1,002,289 784,444
Roasting equipment ....................................... 208,816 197,004
Furniture, fixtures and other . . ............................... 559,077 523,275
5,091,271 4,082,705
Less accumulated depreciation and amortization .................. (2,416,142) (1,969,804)
2,675,129 2,112,901
Work in progress ......................................... 215,304 174,998
Property, plant and equipment, net ............................ $2,890,433 $ 2,287,899
Note 8: Other Intangible Assets and Goodwill
As of September 30, 2007, indefinite-lived intangibles were $36.9 million and definite-lived intangibles, which
collectively had a remaining weighted average useful life of approximately eight years, were $5.1 million, net of
accumulated amortization of $4.3 million. As of October 1, 2006, indefinite-lived intangibles were $34.1 million
and definite-lived intangibles, which collectively had a remaining weighted average useful life of approximately
eight years, were $3.9 million, net of accumulated amortization of $3.4 million. The increase in indefinite-lived
intangibles was primarily due to ongoing trademark activity. Amortization expense for definite-lived intangibles
was $1.0 million, $1.2 million and $0.8 million during fiscal 2007, 2006 and 2005, respectively.
The following table summarizes, as of September 30, 2007, the estimated amortization expense for each of the next
five fiscal years (in thousands):
Fiscal Year Ending
2008 ................................................................. $1,203
2009 ................................................................. 1,065
2010 ................................................................. 601
2011 ................................................................. 547
2012 ................................................................. 447
Thereafter ............................................................. 1,256
Total ................................................................. $5,119
The changes in the carrying amount of goodwill by reportable operating segment for the fiscal year ended
September 30, 2007 are as follows (in thousands):
United States International Global CPG Total
Balance as of October 1, 2006 ............ $125,976 $25,802 $9,700 $161,478
Business Acquisitions (see Note 2)....... — 51,289 — 51,289
Purchase price adjustment of previous
acquisitions ...................... 1,660 — — 1,660
Other............................. — 1,198 — 1,198
Balance as of September 30, 2007 ......... $127,636 $78,289 $9,700 $215,625
56