UPS 2009 Annual Report Download - page 83
Download and view the complete annual report
Please find page 83 of the 2009 UPS annual report below. You can navigate through the pages in the report by either clicking on the pages listed below, or by using the keyword search tool below to find specific information within the annual report.-
 1
1 -
2
-
3
-
4
-
5
-
6
-
7
-
8
-
9
-
10
-
11
-
12
-
13
-
14
-
15
-
16
-
17
-
18
-
19
-
20
-
21
-
22
-
23
-
24
-
25
-
26
-
27
-
28
-
29
-
30
-
31
-
32
-
33
-
34
-
35
-
36
-
37
-
38
-
39
-
40
-
41
-
42
-
43
-
44
-
45
-
46
-
47
-
48
-
49
-
50
-
51
-
52
-
53
-
54
-
55
-
56
-
57
-
58
-
59
-
60
-
61
-
62
-
63
-
64
-
65
-
66
-
67
-
68
-
69
-
70
-
71
-
72
-
 73
73 -
 74
74 -
 75
75 -
 76
76 -
 77
77 -
 78
78 -
 79
79 -
 80
80 -
 81
81 -
 82
82 -
 83
83 -
 84
84 -
 85
85 -
 86
86 -
 87
87 -
 88
88 -
 89
89 -
 90
90 -
 91
91 -
 92
92 -
 93
93 -
94
-
95
-
96
-
97
-
98
-
99
-
100
-
101
-
102
-
103
-
104
-
105
-
106
-
107
-
108
-
109
-
110
-
111
-
112
-
113
-
114
-
115
-
116
-
117
-
118
-
119
-
120
-
121
-
122
-
123
-
124
-
125
-
126
-
127
-
128
-
129
-
130
-
131
 |
 |

UNITED PARCEL SERVICE, INC. AND SUBSIDIARIES
NOTES TO CONSOLIDATED FINANCIAL STATEMENTS—(Continued)
Company matches, in shares of UPS common stock or cash, a portion of the participating employees’
contributions. In early 2009, we indefinitely suspended the company matching contributions to the primary
employee defined contribution plan. Matching contributions charged to expense were $21, $116, and $128
million for 2009, 2008, and 2007, respectively.
Contributions are also made to defined contribution money purchase plans under certain collective
bargaining agreements. Amounts charged to expense were $80, $78, and $72 million for 2009, 2008, and 2007,
respectively.
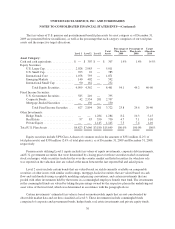
Net Periodic Benefit Cost
Information about net periodic benefit cost for the company-sponsored pension and postretirement benefit
plans is as follows (in millions):
U.S. Pension Benefits
U.S. Postretirement
Medical Benefits
International
Pension Benefits
2009 2008 2007 2009 2008 2007 2009 2008 2007
Net Periodic Cost:
Service cost .................... $ 689 $ 707 $ 520 $ 85 $ 96 $101 $ 17 $ 26 $ 31
Interest cost .................... 1,130 1,051 835 211 202 182 28 31 31
Expected return on assets .......... (1,488) (1,517) (1,302) (27) (49) (46) (26) (35) (31)
Amortization of:
Transition obligation .........453——————
Prior service cost ............ 178 184 57 6 (4) (8) 1 1 1
Actuarial (gain) loss .......... 46 8 109 14 20 22 — — 5
Other .......................... 3 — — — — 3 1 — —
Net periodic benefit cost .......... $ 562 $ 438 $ 222 $289 $265 $254 $ 21 $ 23 $ 37
Actuarial Assumptions
The table below provides the weighted-average actuarial assumptions used to determine the net periodic
benefit cost.
Pension Benefits
Postretirement Medical
Benefits
International Pension
Benefits
2009 2008 2007 2009 2008 2007 2009 2008 2007
Discount rate .................... 6.75% 6.47% 6.00% 6.66% 6.25% 6.00% 6.17% 5.57% 4.97%
Rate of compensation increase ...... 4.50% 4.50% 4.50% N/A N/A N/A 3.65% 3.64% 3.40%
Expected return on assets .......... 8.96% 8.96% 8.96% 9.00% 9.00% 9.00% 7.09% 7.54% 7.53%
The table below provides the weighted-average actuarial assumptions used to determine the benefit
obligations of our plans.
Pension Benefits
Postretirement
Medical Benefits
International
Pension Benefits
2009 2008 2009 2008 2009 2008
Discount rate ........................................ 6.58% 6.75% 6.43% 6.66% 5.84% 6.17%
Rate of compensation increase .......................... 4.50% 4.50% N/A N/A 3.62% 3.65%
71