UPS 2009 Annual Report Download - page 89
Download and view the complete annual report
Please find page 89 of the 2009 UPS annual report below. You can navigate through the pages in the report by either clicking on the pages listed below, or by using the keyword search tool below to find specific information within the annual report.-
 1
1 -
2
-
3
-
4
-
5
-
6
-
7
-
8
-
9
-
10
-
11
-
12
-
13
-
14
-
15
-
16
-
17
-
18
-
19
-
20
-
21
-
22
-
23
-
24
-
25
-
26
-
27
-
28
-
29
-
30
-
31
-
32
-
33
-
34
-
35
-
36
-
37
-
38
-
39
-
40
-
41
-
42
-
43
-
44
-
45
-
46
-
47
-
48
-
49
-
50
-
51
-
52
-
53
-
54
-
55
-
56
-
57
-
58
-
59
-
60
-
61
-
62
-
63
-
64
-
65
-
66
-
67
-
68
-
69
-
70
-
71
-
72
-
73
-
74
-
75
-
76
-
77
-
78
-
 79
79 -
 80
80 -
 81
81 -
 82
82 -
 83
83 -
 84
84 -
 85
85 -
 86
86 -
 87
87 -
 88
88 -
 89
89 -
 90
90 -
 91
91 -
 92
92 -
 93
93 -
 94
94 -
 95
95 -
 96
96 -
 97
97 -
 98
98 -
 99
99 -
100
-
101
-
102
-
103
-
104
-
105
-
106
-
107
-
108
-
109
-
110
-
111
-
112
-
113
-
114
-
115
-
116
-
117
-
118
-
119
-
120
-
121
-
122
-
123
-
124
-
125
-
126
-
127
-
128
-
129
-
130
-
131
 |
 |

UNITED PARCEL SERVICE, INC. AND SUBSIDIARIES
NOTES TO CONSOLIDATED FINANCIAL STATEMENTS—(Continued)
The commingled funds are valued using net asset values, adjusted, as appropriate, for investment fund specific
inputs determined to be significant to the valuation. Investments in hedge funds are valued using reported net
asset values as of December 31. These assets are primarily invested in a portfolio of diversified, direct
investments and funds of hedge funds. Real estate investments and private equity funds are valued using fair
values per the most recent partnership audited financial reports, adjusted as appropriate for any lag between the
date of the financial reports and December 31. The real estate investments consist of U.S. and non-U.S. real
estate investments and are broadly diversified. The fair values may, due to the inherent uncertainty of valuation
for those alternative investments, differ significantly from the values that would have been used had a ready
market for the alternative investments existed, and the differences could be material.
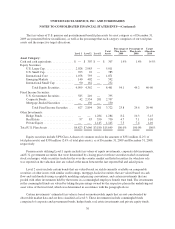
The fair value measurement of plan assets using significant unobservable inputs (Level 3) changed during
2009 due to the following (in millions):
Corporate
Bonds Hedge Funds Real Estate
Private
Equity Total
Balance on January 1, 2009 ........... $ 95 $1,312 $ 802 $1,015 $3,224
Actual Return on Assets:
Assets Held at End of Year ....... 30 33 (185) 110 (12)
Assets Sold During the Year ...... — 11 (1) — 10
Purchases, Sales, and Settlements ...... 76 (72) (66) 20 (42)
Transfers Into (Out of) Level 3 ........ — — — — —
Balance on December 31, 2009 ........ $201 $1,284 $ 550 $1,145 $3,180
The fair value disclosures above have not been provided for our international pension benefits plans since
asset allocations are determined and managed at the individual country level. However, in general, the asset
allocations for these plans (approximately 65% equity securities, 30% debt securities and 5% cash) are similar to
our U.S. plans. The amount of assets having significant unobservable inputs (Level 3), if any, in these plans
would be immaterial to our financial statements.
Expected Cash Flows
Information about expected cash flows for the pension and postretirement benefit plans is as follows (in
millions):
U.S.
Pension Benefits
U.S. Postretirement
Medical Benefits
International Pension
Benefits
Employer Contributions:
2010 (expected) to plan trusts ..................... $ 980 $ — $ 47
2010 (expected) to plan participants ................ 11 90 5
Expected Benefit Payments:
2010 ..................................... $ 526 $ 199 $ 16
2011 ..................................... 600 218 16
2012 ..................................... 677 232 18
2013 ..................................... 759 252 19
2014 ..................................... 848 238 20
2015 - 2019 ................................ 5,819 1,434 119
77