UPS 2012 Annual Report Download - page 51
Download and view the complete annual report
Please find page 51 of the 2012 UPS annual report below. You can navigate through the pages in the report by either clicking on the pages listed below, or by using the keyword search tool below to find specific information within the annual report.-
 1
1 -
2
-
3
-
4
-
5
-
6
-
7
-
8
-
9
-
10
-
11
-
12
-
13
-
14
-
15
-
16
-
17
-
18
-
19
-
20
-
21
-
22
-
23
-
24
-
25
-
26
-
27
-
28
-
29
-
30
-
31
-
32
-
33
-
34
-
35
-
36
-
37
-
38
-
39
-
40
-
 41
41 -
 42
42 -
 43
43 -
 44
44 -
 45
45 -
 46
46 -
 47
47 -
 48
48 -
 49
49 -
 50
50 -
 51
51 -
 52
52 -
 53
53 -
 54
54 -
 55
55 -
 56
56 -
 57
57 -
 58
58 -
 59
59 -
 60
60 -
 61
61 -
62
-
63
-
64
-
65
-
66
-
67
-
68
-
69
-
70
-
71
-
72
-
73
-
74
-
75
-
76
-
77
-
78
-
79
-
80
-
81
-
82
-
83
-
84
-
85
-
86
-
87
-
88
-
89
-
90
-
91
-
92
-
93
-
94
-
95
-
96
-
97
-
98
-
99
-
100
-
101
-
102
-
103
-
104
-
105
-
106
-
107
-
108
-
109
-
110
-
111
-
112
-
113
-
114
-
115
-
116
-
117
-
118
-
119
-
120
-
121
-
122
-
123
-
124
-
125
-
126
-
127
 |
 |

UNITED PARCEL SERVICE, INC. AND SUBSIDIARIES
MANAGEMENT'S DISCUSSION AND ANALYSIS OF FINANCIAL CONDITION AND
RESULTS OF OPERATIONS
39
Liquidity and Capital Resources
Operating Activities
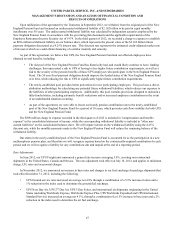
The following is a summary of the significant sources (uses) of cash from operating activities (amounts in millions):
2012 2011 2010
Net income $ 807 $ 3,804 $ 3,338
Non-cash operating activities(a) 7,301 4,505 4,398
Pension and postretirement plan contributions (UPS-sponsored plans) (917)(1,436)(3,240)
Income tax receivables and payables 280 236 (319)
Changes in working capital and other noncurrent assets and liabilities (148)(12)(340)
Other operating activities (107)(24)(2)
Net cash from operating activities $ 7,216 $ 7,073 $ 3,835
(a) Represents depreciation and amortization, gains and losses on derivative and foreign exchange transactions, deferred
income taxes, provisions for uncollectible accounts, pension and postretirement benefit expense, stock compensation
expense, impairment charges and other non-cash items.
Cash from operating activities remained strong throughout the 2010 to 2012 time period. Operating cash flow was
favorably impacted in 2012, compared with 2011, by lower contributions into our defined benefit pension and postretirement
benefit plans; however, this was partially offset by changes in our working capital position, which was impacted by overall
growth in the business. The change in the cash flows for income tax receivables and payables in 2011 and 2010 was primarily
related to the timing of discretionary pension contributions during 2010, as discussed further in the following paragraph.
Except for discretionary or accelerated fundings of our plans, contributions to our company-sponsored pension plans
have largely varied based on whether any minimum funding requirements are present for individual pension plans.
• In 2012, we made a $355 million required contribution to the UPS IBT Pension Plan.
• In 2011, we made a $1.2 billion contribution to the UPS IBT Pension Plan, which satisfied our 2011 contribution
requirements and also approximately $440 million in contributions that would not have been required until after 2011.
• In 2010, we made $2.0 billion in discretionary contributions to our UPS Retirement and UPS Pension Plans, and $980
million in required contributions to our UPS IBT Pension Plan.
• The remaining contributions in the 2010 through 2012 period were largely due to contributions to our international
pension plans and U.S. postretirement medical benefit plans.
As discussed further in the “Contractual Commitments” section, we have minimum funding requirements in the next
several years, primarily related to the UPS IBT Pension, UPS Retirement and UPS Pension plans.
As of December 31, 2012, the total of our worldwide holdings of cash and cash equivalents was $7.327 billion.
Approximately $4.211 billion of this amount was held in European subsidiaries with the intended purpose of completing the
acquisition of TNT Express N.V. (see note 16 to the consolidated financial statements). Excluding this portion of cash held
outside the U.S. for acquisition-related purposes, approximately 50%-60% of the remaining cash and cash equivalents are held
by foreign subsidiaries throughout the year. The amount of cash held by our U.S. and foreign subsidiaries fluctuates throughout
the year due to a variety of factors, including the timing of cash receipts and disbursements in the normal course of business.
Cash provided by operating activities in the United States continues to be our primary source of funds to finance domestic
operating needs, capital expenditures, share repurchases and dividend payments to shareowners. To the extent that such
amounts represent previously untaxed earnings, the cash held by foreign subsidiaries would be subject to tax if such amounts
were repatriated in the form of dividends; however, not all international cash balances would have to be repatriated in the form
of a dividend if returned to the U.S. When amounts earned by foreign subsidiaries are expected to be indefinitely reinvested,
no accrual for taxes is provided.