UPS 2012 Annual Report Download - page 84
Download and view the complete annual report
Please find page 84 of the 2012 UPS annual report below. You can navigate through the pages in the report by either clicking on the pages listed below, or by using the keyword search tool below to find specific information within the annual report.-
 1
1 -
2
-
3
-
4
-
5
-
6
-
7
-
8
-
9
-
10
-
11
-
12
-
13
-
14
-
15
-
16
-
17
-
18
-
19
-
20
-
21
-
22
-
23
-
24
-
25
-
26
-
27
-
28
-
29
-
30
-
31
-
32
-
33
-
34
-
35
-
36
-
37
-
38
-
39
-
40
-
41
-
42
-
43
-
44
-
45
-
46
-
47
-
48
-
49
-
50
-
51
-
52
-
53
-
54
-
55
-
56
-
57
-
58
-
59
-
60
-
61
-
62
-
63
-
64
-
65
-
66
-
67
-
68
-
69
-
70
-
71
-
72
-
73
-
 74
74 -
 75
75 -
 76
76 -
 77
77 -
 78
78 -
 79
79 -
 80
80 -
 81
81 -
 82
82 -
 83
83 -
 84
84 -
 85
85 -
 86
86 -
 87
87 -
 88
88 -
 89
89 -
 90
90 -
 91
91 -
 92
92 -
 93
93 -
 94
94 -
95
-
96
-
97
-
98
-
99
-
100
-
101
-
102
-
103
-
104
-
105
-
106
-
107
-
108
-
109
-
110
-
111
-
112
-
113
-
114
-
115
-
116
-
117
-
118
-
119
-
120
-
121
-
122
-
123
-
124
-
125
-
126
-
127
 |
 |

UNITED PARCEL SERVICE, INC. AND SUBSIDIARIES
NOTES TO CONSOLIDATED FINANCIAL STATEMENTS
72
Pension and Postretirement Plan Assets
The applicable benefit plan committees establish investment guidelines and strategies, and regularly monitor the
performance of the funds and portfolio managers. Our investment guidelines address the following items: governance, general
investment beliefs and principles, investment objectives, specific investment goals, process for determining/maintaining the
asset allocation policy, long-term asset allocation, rebalancing, investment restrictions/prohibited transactions, portfolio
manager structure and diversification (which addresses limits on the amount of investments held by any one manager to
minimize risk), portfolio manager selection criteria, plan evaluation, portfolio manager performance review and evaluation and
risk management (including various measures used to evaluate risk tolerance).
Our investment strategy with respect to pension assets is to invest the assets in accordance with applicable laws and
regulations. The long-term primary objectives for our pension assets are to: (1) provide for a reasonable amount of long-term
growth of capital, with prudent exposure to risk; and protect the assets from erosion of purchasing power; (2) provide
investment results that meet or exceed the plans’ expected long-term rate of return; and (3) match the duration of the liabilities
and assets of the plans to reduce the potential risk of large employer contributions being necessary in the future. The plans
strive to meet these objectives by employing portfolio managers to actively manage assets within the guidelines and strategies
set forth by the benefit plan committees. These managers are evaluated by comparing their performance to applicable
benchmarks.
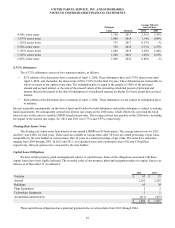
The fair values of U.S. pension and postretirement benefit plan assets by asset category as of December 31, 2012 are
presented below (in millions), as well as the percentage that each category comprises of our total plan assets and the respective
target allocations.
Level 1 Level 2 Level 3
Total
Assets
Percentage of
Plan Assets -
2012
Target
Allocation
2012
Asset Category:
Cash and cash equivalents $ 103 $ 139 $ — $ 242 0.9% 0-5
Equity Securities:
U.S. Large Cap 2,548 2,162 — 4,710
U.S. Small Cap 450 31 — 481
Emerging Markets 1,160 123 — 1,283
Global Equity 2,242 — — 2,242
International Equity 442 694 — 1,136
Total Equity Securities 6,842 3,010 — 9,852 38.8 35-55
Fixed Income Securities:
U.S. Government Securities 4,008 443 — 4,451
Corporate Bonds 9 3,113 138 3,260
Global Bonds — 457 — 457
Municipal Bonds — 83 — 83
Total Fixed Income Securities 4,017 4,096 138 8,251 32.5 25-35
Other Investments:
Hedge Funds — — 2,829 2,829 11.1 5-15
Private Equity — — 1,416 1,416 5.6 1-10
Real Estate 177 23 1,039 1,239 4.9 1-10
Structured Products(1) — 210 — 210 0.8 0-5
Other(2) — — 1,362 1,362 5.4 1-10
Total U.S. Plan Assets $11,139 $ 7,478 $ 6,784 $ 25,401 100.0%
(1) Represents mortgage and asset-backed securities.
(2) Represents global balanced-risk commingled funds, consisting primarily of equity, bonds, and some currencies and
commodities.