UPS 2015 Annual Report Download - page 39
Download and view the complete annual report
Please find page 39 of the 2015 UPS annual report below. You can navigate through the pages in the report by either clicking on the pages listed below, or by using the keyword search tool below to find specific information within the annual report.-
 1
1 -
2
-
3
-
4
-
5
-
6
-
7
-
8
-
9
-
10
-
11
-
12
-
13
-
14
-
15
-
16
-
17
-
18
-
19
-
20
-
21
-
22
-
23
-
24
-
25
-
26
-
27
-
28
-
 29
29 -
 30
30 -
 31
31 -
 32
32 -
 33
33 -
 34
34 -
 35
35 -
 36
36 -
 37
37 -
 38
38 -
 39
39 -
 40
40 -
 41
41 -
 42
42 -
 43
43 -
 44
44 -
 45
45 -
 46
46 -
 47
47 -
 48
48 -
 49
49 -
50
-
51
-
52
-
53
-
54
-
55
-
56
-
57
-
58
-
59
-
60
-
61
-
62
-
63
-
64
-
65
-
66
-
67
-
68
-
69
-
70
-
71
-
72
-
73
-
74
-
75
-
76
-
77
-
78
-
79
-
80
-
81
-
82
-
83
-
84
-
85
-
86
-
87
-
88
-
89
-
90
-
91
-
92
-
93
-
94
-
95
-
96
-
97
-
98
-
99
-
100
-
101
-
102
-
103
-
104
-
105
-
106
-
107
-
108
-
109
-
110
-
111
-
112
-
113
-
114
-
115
-
116
-
117
-
118
-
119
-
120
-
121
-
122
-
123
-
124
-
125
-
126
-
127
-
128
-
129
-
130
-
131
-
132
-
133
-
134
-
135
-
136
-
137
-
138
-
139
-
140
-
141
-
142
-
143
-
144
-
145
-
146
-
147
-
148
 |
 |

UNITED PARCEL SERVICE, INC. AND SUBSIDIARIES
MANAGEMENT'S DISCUSSION AND ANALYSIS OF FINANCIAL CONDITION AND
RESULTS OF OPERATIONS
27
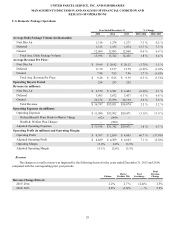
The $118 million and $1.062 billion pre-tax mark-to-market losses for the years ended December 31, 2015 and 2014,
respectively, were comprised of the following components:
2015 - $118 million pre-tax mark-to-market loss:
• Discount Rates ($1.624 billion pre-tax gain): The weighted-average discount rate for our pension and
postretirement medical plans increased from 4.36% at December 31, 2014 to 4.81% at December 31, 2015,
primarily due to an increase in U.S. treasury yields and credit spreads on AA-rated corporate bonds in 2015.
• Return on Assets ($1.550 billion pre-tax loss): In 2015, the actual 0.37% rate of return on plan assets fell short of
our expected rate of return of 8.66%, primarily due to weak global equity markets.
• Demographic and Assumption Changes ($133 million pre-tax loss): This represents the difference between actual
and estimated participant data and demographic factors, including items such as health care cost trends,
compensation rate increases, and rates of termination, retirement and mortality.
• Reclassification of Prior Year Unrecognized Benefit Cost ($59 million pre-tax loss): Our mark-to-market
accounting policy requires recognition of gains and losses in excess of a corridor equal to 10% of the plans'
projected benefit obligations (or fair value of the plans' assets, if greater). The decrease in certain plans' projected
benefit obligations resulted in a lower corridor, which required recognition of prior year unrecognized benefit
costs for some of our plans.
2014 - $1.062 billion pre-tax mark-to-market loss:
• Discount Rates ($954 million pre-tax loss): The weighted-average discount rate for our pension and
postretirement medical plans declined from 5.24% at December 31, 2013 to 4.36% at December 31, 2014. This
overall decline in discount rates was primarily driven by a 122 basis point decline in the 30 year Treasury bond
rate, but was partially offset by an increase in credit spreads on AA-rated 30 year bonds.
• Return on Assets ($42 million pre-tax gain): In 2014, the actual rate of return on plan assets of 9.45% exceeded
our expected rate of return of 8.66%, primarily due to gains in the world equity markets.
• Demographic and Assumption Changes ($150 million pre-tax loss): The implementation of new U.S. mortality
tables in 2014 resulted in an increased participant life expectancy assumption, which increased the overall
projected benefit obligation for our plans.
Health and Welfare Plan Charges
In connection with the ratification of our national master agreement with the International Brotherhood of Teamsters
("Teamsters") in 2014, we incurred pre-tax charges totaling $1.102 billion ($687 million after-tax) associated with changes in
the delivery of healthcare benefits to certain active and retired union employees. These charges are discussed in further detail in
the "Collective Bargaining Agreements" section. These charges impacted our U.S. Domestic Package segment ($990 million),
International Package segment ($28 million) and Supply Chain & Freight segment ($84 million).
TNT Termination Fee and Related Expenses
On January 30, 2013, the European Commission issued a formal decision prohibiting our proposed acquisition of TNT
Express N.V. ("TNT Express"). As a result of the prohibition by the European Commission, the condition of our offer requiring
European Union competition clearance was not fulfilled, and our proposed acquisition of TNT Express could not be completed.
Given this outcome, UPS and TNT Express entered a separate agreement to terminate the merger protocol, and we withdrew
our formal offer for TNT Express. We paid a termination fee to TNT Express of €200 million ($268 million) under this
agreement, and also incurred transaction-related expenses of $16 million during 2013. The combination of these items resulted
in a pre-tax charge of $284 million ($177 million after-tax), which impacted our International Package segment.