UPS 2015 Annual Report Download - page 95
Download and view the complete annual report
Please find page 95 of the 2015 UPS annual report below. You can navigate through the pages in the report by either clicking on the pages listed below, or by using the keyword search tool below to find specific information within the annual report.-
 1
1 -
2
-
3
-
4
-
5
-
6
-
7
-
8
-
9
-
10
-
11
-
12
-
13
-
14
-
15
-
16
-
17
-
18
-
19
-
20
-
21
-
22
-
23
-
24
-
25
-
26
-
27
-
28
-
29
-
30
-
31
-
32
-
33
-
34
-
35
-
36
-
37
-
38
-
39
-
40
-
41
-
42
-
43
-
44
-
45
-
46
-
47
-
48
-
49
-
50
-
51
-
52
-
53
-
54
-
55
-
56
-
57
-
58
-
59
-
60
-
61
-
62
-
63
-
64
-
65
-
66
-
67
-
68
-
69
-
70
-
71
-
72
-
73
-
74
-
75
-
76
-
77
-
78
-
79
-
80
-
81
-
82
-
83
-
84
-
 85
85 -
 86
86 -
 87
87 -
 88
88 -
 89
89 -
 90
90 -
 91
91 -
 92
92 -
 93
93 -
 94
94 -
 95
95 -
 96
96 -
 97
97 -
 98
98 -
 99
99 -
 100
100 -
 101
101 -
 102
102 -
 103
103 -
 104
104 -
 105
105 -
106
-
107
-
108
-
109
-
110
-
111
-
112
-
113
-
114
-
115
-
116
-
117
-
118
-
119
-
120
-
121
-
122
-
123
-
124
-
125
-
126
-
127
-
128
-
129
-
130
-
131
-
132
-
133
-
134
-
135
-
136
-
137
-
138
-
139
-
140
-
141
-
142
-
143
-
144
-
145
-
146
-
147
-
148
 |
 |

UNITED PARCEL SERVICE, INC. AND SUBSIDIARIES
NOTES TO CONSOLIDATED FINANCIAL STATEMENTS
83
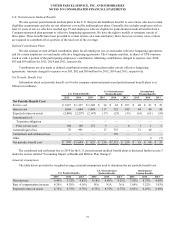
The fair values of U.S. and international pension and postretirement benefit plan assets by asset category as of
December 31, 2015 are presented below (in millions), as well as the percentage that each category comprises of our total plan
assets and the respective target allocations.
Level 1 Level 2 Level 3
Total
Assets
Percentage of
Plan Assets -
2015
Target
Allocation
2015
Asset Category (U.S. Plans):
Cash and cash equivalents $ 716 $ 95 $ — $ 811 2.8% 0-5
Equity Securities:
U.S. Large Cap 2,542 1,704 — 4,246
U.S. Small Cap 310 42 — 352
Emerging Markets 1,271 155 — 1,426
Global Equity 2,935 — — 2,935
International Equity 2,308 781 — 3,089
Total Equity Securities 9,366 2,682 — 12,048 41.5 35-55
Fixed Income Securities:
U.S. Government Securities 3,257 212 — 3,469
Corporate Bonds — 3,682 279 3,961
Global Bonds — 147 586 733
Municipal Bonds — 36 — 36
Total Fixed Income Securities 3,257 4,077 865 8,199 28.2 25-35
Other Investments:
Hedge Funds — — 3,617 3,617 12.5 5-15
Private Equity — — 1,415 1,415 4.9 1-10
Real Estate 126 155 1,567 1,848 6.4 1-10
Structured Products(1) — 324 — 324 1.1 0-5
Risk Parity Funds — — 755 755 2.6 1-10
Total U.S. Plan Assets $13,465 $ 7,333 $ 8,219 $ 29,017 100.0%
Asset Category (International Plans):
Cash and cash equivalents $ 9 $ 16 $ — 25 2.5 0-5
Equity Securities:
Local Markets Equity 133 107 — 240
U.S. Equity 16 — — 16
Emerging Markets 16 — — 16
International / Global Equity 84 92 — 176
Total Equity Securities 249 199 — 448 44.1 50-65
Fixed Income Securities:
Local Government Bonds 72 — — 72
Corporate Bonds 56 93 — 149
Total Fixed Income Securities 128 93 — 221 21.8 15-35
Other Investments:
Real Estate — 111 — 111 10.9 0-17
Other — 160 49 209 20.7 0-20
Total International Plan Assets $ 386 $ 579 $ 49 $ 1,014 100.0%
Total Plan Assets $13,851 $ 7,912 $ 8,268 $ 30,031
(1) Represents mortgage and asset-backed securities.