Walmart 2009 Annual Report Download - page 20
Download and view the complete annual report
Please find page 20 of the 2009 Walmart annual report below. You can navigate through the pages in the report by either clicking on the pages listed below, or by using the keyword search tool below to find specific information within the annual report.-
 1
1 -
2
-
3
-
4
-
5
-
6
-
7
-
8
-
9
-
 10
10 -
 11
11 -
 12
12 -
 13
13 -
 14
14 -
 15
15 -
 16
16 -
 17
17 -
 18
18 -
 19
19 -
 20
20 -
 21
21 -
 22
22 -
 23
23 -
 24
24 -
 25
25 -
 26
26 -
 27
27 -
 28
28 -
 29
29 -
 30
30 -
31
-
32
-
33
-
34
-
35
-
36
-
37
-
38
-
39
-
40
-
41
-
42
-
43
-
44
-
45
-
46
-
47
-
48
-
49
-
50
-
51
-
52
-
53
-
54
-
55
-
56
-
57
-
58
-
59
-
60
 |
 |

The calculation of ROI along with a reconciliation to the calculation of ROA, the most comparable GAAP nancial measurement, is as follows:
Fiscal Year Ended January 31,
(Amounts in millions) 2009 2008
Calculation of return on investment
Numerator
Operating income (1) $ 22,798 $ 21,952
+ Interest income (1) 284 309
+ Depreciation and amortization (1) 6,739 6,317
+ Rent (1) 1,751 1,604
= Adjusted operating income $ 31,572 $ 30,182
Denominator
Average total assets of continuing operations (2) $162,891 $156,603
+ Average accumulated depreciation and amortization (2) 33,317 28,828
- Average accounts payable (2) 29,597 29,409
- Average accrued liabilities (2) 16,919 15,183
+ Rent x 8 14,008 12,832
= Invested capital $163,700 $153,671
ROI 19.3% 19.6%
Calculation of return on assets
Numerator
Income from continuing operations before minority interest (1) $ 13,753 $ 13,269
Denominator
Average total assets of continuing operations (2) $162,891 $156,603
ROA 8.4% 8.5%
Certain Balance Sheet Data
January 31, 2009 2008 2007
Total assets of continuing operations (1) $163,234 $162,547 $150,658
Accumulated depreciation and amortization (1) 35,508 31,125 26,530
Accounts payable (1) 28,849 30,344 28,473
Accrued liabilities (1) 18,112 15,725 14,641
(1) Based on continuing operations only; therefore, this excludes the impact of our South Korean and German operations, which were sold in scal 2007, the impact of
Gazeley which was re ected as a sale in the third quarter of scal 2009, and the impact of Seiyu store closures and other property divestitures in scal 2009, all of which
are classi ed as discontinued operations for all periods presented. Total assets as of January 31, 2009, 2008 and 2007 in the table above exclude assets of discontinued
operations of $195 million, $967 million and $929 million, respectively.
(2) The average is based on the addition of the account balance at the end of the current period to the account balance at the end of the prior period and dividing by 2.
18 Wal-Mart 2009 Annual Report
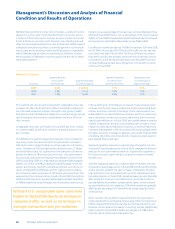
Management’s Discussion and Analysis of Financial
Condition and Results of Operations