Walmart 2009 Annual Report Download - page 22
Download and view the complete annual report
Please find page 22 of the 2009 Walmart annual report below. You can navigate through the pages in the report by either clicking on the pages listed below, or by using the keyword search tool below to find specific information within the annual report.-
 1
1 -
2
-
3
-
4
-
5
-
6
-
7
-
8
-
9
-
10
-
11
-
 12
12 -
 13
13 -
 14
14 -
 15
15 -
 16
16 -
 17
17 -
 18
18 -
 19
19 -
 20
20 -
 21
21 -
 22
22 -
 23
23 -
 24
24 -
 25
25 -
 26
26 -
 27
27 -
 28
28 -
 29
29 -
 30
30 -
 31
31 -
 32
32 -
33
-
34
-
35
-
36
-
37
-
38
-
39
-
40
-
41
-
42
-
43
-
44
-
45
-
46
-
47
-
48
-
49
-
50
-
51
-
52
-
53
-
54
-
55
-
56
-
57
-
58
-
59
-
60
 |
 |

20 Wal-Mart 2009 Annual Report
Management’s Discussion and Analysis of Financial
Condition and Results of Operations
Membership and other income, which includes a variety of income
categories such as Sam’s Club membership fee revenues, tenant
income and nancial services income, as a percentage of net sales
for scal 2009 was consistent with the prior year. Membership and
other income as a percentage of net sales for scal year 2008 increased
compared to the prior year due to continued growth in our nancial
services area and in recycling income resulting from our sustainability
e orts. Membership and other income for scal 2008 also includes
the recognition of $188 million in pre-tax gains from the sale of certain
real estate properties.
Interest, net, as a percentage of net sales was consistent between scal
2009 and scal 2008. Interest, net, as percentage of net sales increased
slightly in scal 2008 compared to scal 2007 primarily due to increased
borrowing levels and higher interest rates on our oating debt.
Our e ective income tax rate was 34.2% for scal years 2009 and 2008,
and 33.5% for scal year 2007. The scal 2009 e ective tax rate was
consistent with that of scal 2008. The scal 2008 rate was higher
than the scal 2007 rate primarily due to the mix of earnings among
our domestic and international operations and favorable resolution
of certain federal and state tax contingencies in scal 2007 in excess
of those in scal 2008.
The segment net sales growth resulted from comparable store sales
increases of 3.2% in scal 2009 and 1.0% in scal 2008, in addition to
our continued expansion activities. Strength in the grocery, health
and wellness and entertainment categories as well as strong seasonal
sales throughout the year also contributed to the scal 2009 net
sales increase.
Comparable store sales were higher in scal 2009 due to an increase
in customer tra c, as well as an increase in average transaction size
per customer.
The Walmart U.S. segment expansion programs consist of opening
new units, converting discount stores to supercenters, relocations
that result in more square footage, as well as expansions of existing
stores. During scal 2009 we opened two discount stores, 23 Neigh-
borhood Markets and 165 supercenters (including the conversion
and/or relocation of 78 existing discount stores into supercenters).
Four discount stores and two Neighborhood Markets closed in scal
2009. During scal 2009, our total expansion program added approxi-
mately 22.7 million or 4.0% of additional square footage, net of relo-
cations and closings. During scal 2008 we opened seven discount
stores, 20 Neighborhood Markets and 191 supercenters (including
the conversion and/or relocation of 109 existing discount stores into
supercenters). Two discount stores closed in scal 2008. During scal
2008, our total expansion program added approximately 26 million
or 4.8% of additional square footage, net of relocations and closings.
In scal 2009, gross pro t margin increased 0.3 percentage points
compared to the prior year primarily due to decreased markdown
activity and lower inventory shrinkage. These improvements are
attributable to our merchandising initiatives which are improving
space allocation, enhancing our price leadership and increasing
supply chain e ciencies. In scal 2008, gross pro t margin increased
slightly compared to the prior year primarily due to higher initial
margins and decreased markdown activity as a result of improved
inventory management in the second half of the year, partially o set
by higher inventory shrinkage. In addition, gross pro t for scal 2008
included a $46 million excise tax refund on taxes previously paid on
past prepaid phone card sales.
Segment operating expenses as a percentage of segment net sales
increased 0.3 percentage points in scal 2009 compared to the prior
year due to hurricane-related expenses, higher bonus payments
for store associates, higher utility costs and an increase in health
bene t costs.
Segment operating expenses as a percentage of segment net sales
increased 0.2 percentage points in scal 2008 from scal 2007, primar-
ily due to lower segment net sales increases compared to the prior
year and higher costs associated with our store maintenance and
remodel programs. In scal 2008, operating expenses were favorably
affected by the change in estimated losses associated with our
general liability and worker’s compensation claims, which reduced
accrued liabilities for such claims by $274 million before tax, partially
o set by pre-tax charges of $145 million for certain legal and other
contingencies.
Other income in scal 2009 increased from the prior year due to
continued growth in our nancial services area. Other income in scal
2008 increased from the prior year due to continued growth in our
nancial services area and increases in recycling income. Additionally,
other income for scal 2008 includes pre-tax gains of $188 million
from the sale of certain real estate properties.
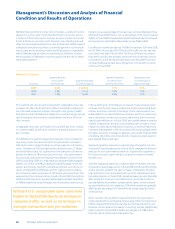
Walmart U.S. Segment
Segment Net Sales Segment Operating Operating Income
Increase from Segment Operating Income Increase as a Percentage of
Fiscal Year Prior Fiscal Year Income (in millions) from Prior Fiscal Year Segment Net Sales
2009 6.8% $18,763 7.1% 7.3%
2008 5.8% 17,516 5.4% 7.3%
2007 7.8% 16,620 8.9% 7.3%
Walmart U.S. comparable store sales were
higher in fiscal 2009 due to an increase in
customer traffic, as well as an increase in
average transaction size per customer.