Walmart 2009 Annual Report Download - page 23
Download and view the complete annual report
Please find page 23 of the 2009 Walmart annual report below. You can navigate through the pages in the report by either clicking on the pages listed below, or by using the keyword search tool below to find specific information within the annual report.-
 1
1 -
2
-
3
-
4
-
5
-
6
-
7
-
8
-
9
-
10
-
11
-
12
-
 13
13 -
 14
14 -
 15
15 -
 16
16 -
 17
17 -
 18
18 -
 19
19 -
 20
20 -
 21
21 -
 22
22 -
 23
23 -
 24
24 -
 25
25 -
 26
26 -
 27
27 -
 28
28 -
 29
29 -
 30
30 -
 31
31 -
 32
32 -
 33
33 -
34
-
35
-
36
-
37
-
38
-
39
-
40
-
41
-
42
-
43
-
44
-
45
-
46
-
47
-
48
-
49
-
50
-
51
-
52
-
53
-
54
-
55
-
56
-
57
-
58
-
59
-
60
 |
 |

21Wal-Mart 2009 Annual Report
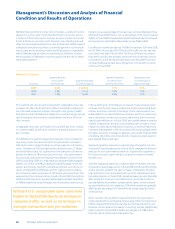
International Segment
Segment Net Sales Segment Operating Operating Income
Increase from Segment Operating Income Increase as a Percentage of
Fiscal Year Prior Fiscal Year Income (in millions) from Prior Fiscal Year Segment Net Sales
2009 9.1% $4,940 4.6% 5.0%
2008 17.6% 4,725 10.8% 5.2%
2007 29.8% 4,265 24.8% 5.5%
At January 31, 2009, our International segment was comprised of our
wholly-owned subsidiaries operating in Argentina, Brazil, Canada,
Japan, Puerto Rico and the United Kingdom, our majority-owned
subsidiaries operating in ve countries in Central America, and in
Chile and Mexico, our joint ventures in India and China and our other
controlled subsidiaries in China.
The fiscal 2009 increase in the International segment’s net sales
primarily resulted from net sales growth from existing units and our
international expansion program, o set by the unfavorable impact
of changes in foreign currency exchange rates of $2.3 billion. Our
international expansion program added 517 units and 29.2 million
or 13.1% of additional unit square footage, net of relocations and clos-
ings. The acquisition of Distribución y Servicio contributed 197 stores
and 9.6 million square feet in scal 2009.
The scal 2008 increase in the International segment’s net sales
primarily resulted from net sales growth from existing units, our
international expansion program and the favorable impact of changes
in foreign currency exchange rates of $4.5 billion. Our international
expansion program added 364 units and 34.1 million or 17.9% of
additional unit square footage, net of relocations and closings. The
consolidation of Bounteous Company Limited (“BCL”) contributed
101 stores under the Trust-Mart banner and 17.7 million square feet
in scal 2008.
For additional information regarding our acquisitions, refer to footnote 6
of the Notes to Consolidated Financial Statements.
In scal 2009, the International segment’s gross pro t margin decreased
0.3 percentage points compared to the prior year. The decrease was
primarily driven by growth in lower margin fuel sales in the United
Kingdom and the transition to EDLP as a strategy in Japan.
In scal 2008, gross pro t margin increased by 0.2 percentage points
largely driven by Brazil and the United Kingdom. Gross pro t in Brazil
was favorably impacted by global sourcing initiatives and improved
supplier negotiations. Fiscal 2008 gross pro t in the United Kingdom
was positively impacted by a mix shift toward premium, private-
label food products.
Segment operating expenses as a percentage of segment net sales
decreased slightly in scal 2009 compared to the prior year primarily
as a result of strong cost control measures in the United Kingdom
and every day low cost initiatives in Japan designed to support the
shift to EDLP, partially o set by accruals for certain legal matters.
Segment operating expenses as a percentage of segment net sales
increased 0.3 percentage points in scal 2008 primarily as a result of
an accrual for certain legal matters, the impact of restructuring and
impairment charges at Seiyu, the impact of the consolidation of BCL,
the startup of our joint venture in India and banking operations in
Mexico and overall sales pressures in Mexico.
Other income as a percentage of segment net sales in scal 2009
was consistent with the prior year.
In scal 2009, foreign currency exchange rate changes unfavorably
impacted operating income by $266 million. Although movements
in foreign currency exchange rates cannot reasonably be predicted,
volatility in foreign currency exchange rates, when compared to prior
periods, may continue to impact the International segment’s reported
operating results in the foreseeable future. In scal 2008, foreign cur-
rency exchange rate changes favorably impacted operating income
by $227 million.
The fiscal 2009 increase in the International
segment’s net sales primarily resulted from
net sales growth from existing units and
our international expansion program, off-
set by the unfavorable impact of changes
in foreign currency exchange rates of
$2.3 billion. Our international expansion
program added 517 units and 29.2 million
or 13.1% of additional unit square footage,
net of relocations and closings.