Walmart 2009 Annual Report Download - page 24
Download and view the complete annual report
Please find page 24 of the 2009 Walmart annual report below. You can navigate through the pages in the report by either clicking on the pages listed below, or by using the keyword search tool below to find specific information within the annual report.-
 1
1 -
2
-
3
-
4
-
5
-
6
-
7
-
8
-
9
-
10
-
11
-
12
-
13
-
 14
14 -
 15
15 -
 16
16 -
 17
17 -
 18
18 -
 19
19 -
 20
20 -
 21
21 -
 22
22 -
 23
23 -
 24
24 -
 25
25 -
 26
26 -
 27
27 -
 28
28 -
 29
29 -
 30
30 -
 31
31 -
 32
32 -
 33
33 -
 34
34 -
35
-
36
-
37
-
38
-
39
-
40
-
41
-
42
-
43
-
44
-
45
-
46
-
47
-
48
-
49
-
50
-
51
-
52
-
53
-
54
-
55
-
56
-
57
-
58
-
59
-
60
 |
 |

22 Wal-Mart 2009 Annual Report
Management’s Discussion and Analysis of Financial
Condition and Results of Operations
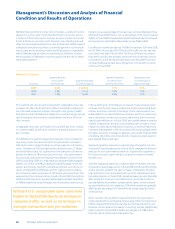
Sam’s Club Segment
Segment Net Sales Segment Operating Operating Income
Increase from Segment Operating Income Increase as a Percentage of
Fiscal Year Prior Fiscal Year Income (in millions) from Prior Fiscal Year Segment Net Sales
2009 5.6% $1,610 -0.5% 3.4%
2008 6.7% 1,618 9.3% 3.6%
2007 4.5% 1,480 5.2% 3.6%
Growth in net sales for the Sam’s Club segment in scal 2009 and
scal 2008 resulted from comparable store sales increases, including
fuel, of 4.8% in scal 2009 and 4.9% in scal 2008, along with our
continued club expansion activities.
The Sam’s Club segment expansion program consists of opening new
units, relocations that result in more square footage, as well as expan-
sions of existing clubs. Eleven new clubs opened in scal 2009 and
12 new clubs opened in scal 2008. No clubs were closed for scal
2009 or 2008. In fiscal 2009, our total expansion program added
approximately 1.7 million or 2.1% additional club square footage,
net of relocations. In scal 2008, our total expansion program added
approximately 2.0 million, or 2.6%, of additional club square footage,
net of relocations.
Comparable club sales increased during scal 2009 due to growth
rates in food and consumables as well as an increase in member tra c
and transaction size per member. Comparable club sales in scal 2008
increased compared to scal 2007 primarily due to growth in food,
pharmacy, electronics and certain consumables categories as well as
an increase in both member tra c and average transaction size per
member. Additionally, fuel sales had a positive impact of 1.2 percent-
age points for scal 2009 and 0.7 percentage points in scal 2008 on
comparable club sales.
Gross pro t margin increased 0.1 percentage points during scal 2009
compared to the prior year due to strong sales in fresh food and other
food-related categories, consumable categories and the positive
impact of a higher fuel gross pro t rate. In scal 2008, gross pro t
margin increased 0.2 percentage points compared to the prior year
due to strong sales in fresh food and other food-related categories,
pharmacy and consumable categories, in addition to the $39 million
excise tax refund on taxes previously paid on prior period prepaid
phone card sales.
Segment operating expenses as a percentage of segment net sales
increased 0.2 percentage points in scal 2009 compared to the prior
year. In scal 2009, operating expenses were negatively impacted by
higher utility costs, an increase in health bene t costs, and hurricane
related expenses.
Segment operating expenses as a percentage of segment net
sales decreased 0.1 percentage points in scal 2008 from scal 2007,
primarily due to a decrease in advertising costs. Additionally, in scal
2008, operating expenses were favorably a ected by the change
in estimated losses associated with our general liability and worker’s
compensation claims, which reduced accrued liabilities for such
claims by $21 million before tax, partially o set by pre-tax charges
of $15 million for certain legal contingencies.
Membership and other income, which includes a variety of income
categories, increased in scal 2009 when compared to scal 2008.
Membership income, which is recognized over the term of the
membership, increased in scal 2009 compared to scal 2008. Mem-
bership and other income increased in scal 2008 when compared
to scal 2007.
Liquidity and Capital Resources
Highlights
Fiscal Year Ended January 31,
(Amounts in millions) 2009 2008 2007
Net cash provided
by operating activities
of continuing operations $ 23,147 $ 20,642 $ 20,280
Purchase of Company stock (3,521) (7,691) (1,718)
Dividends paid (3,746) (3,586) (2,802)
Proceeds from issuance
of long-term debt 6,566 11,167 7,199
Payment of long-term debt (5,387) (8,723) (5,758)
(Decrease) increase
in commercial paper (3,745) 2,376 (1,193)
Total assets of
continuing operations $163,234 $162,547 $150,658
Overview
Cash ows provided by operating activities of continuing operations
supply us with a signi cant source of liquidity. The increases in cash
ows provided by operating activities of continuing operations for each
scal year were primarily attributable to an increase in income from
continuing operations and improved working capital management.
Working Capital
Current liabilities exceeded current assets at January 31, 2009, by
$6.4 billion, a decrease of $4.0 billion from January 31, 2008, largely
due to a reduction in commercial paper outstanding at January 31,
2009. Our ratio of current assets to current liabilities was 0.9 at Janu-
ary 31, 2009 and 0.8 at January 31, 2008. We generally have a working
capital de cit due to our e cient use of cash in funding operations
and in providing returns to shareholders in the form of stock repur-
chases and payment of dividends.