Wells Fargo 2012 Annual Report Download - page 158
Download and view the complete annual report
Please find page 158 of the 2012 Wells Fargo annual report below. You can navigate through the pages in the report by either clicking on the pages listed below, or by using the keyword search tool below to find specific information within the annual report.-
 1
1 -
2
-
3
-
4
-
5
-
6
-
7
-
8
-
9
-
10
-
11
-
12
-
13
-
14
-
15
-
16
-
17
-
18
-
19
-
20
-
21
-
22
-
23
-
24
-
25
-
26
-
27
-
28
-
29
-
30
-
31
-
32
-
33
-
34
-
35
-
36
-
37
-
38
-
39
-
40
-
41
-
42
-
43
-
44
-
45
-
46
-
47
-
48
-
49
-
50
-
51
-
52
-
53
-
54
-
55
-
56
-
57
-
58
-
59
-
60
-
61
-
62
-
63
-
64
-
65
-
66
-
67
-
68
-
69
-
70
-
71
-
72
-
73
-
74
-
75
-
76
-
77
-
78
-
79
-
80
-
81
-
82
-
83
-
84
-
85
-
86
-
87
-
88
-
89
-
90
-
91
-
92
-
93
-
94
-
95
-
96
-
97
-
98
-
99
-
100
-
101
-
102
-
103
-
104
-
105
-
106
-
107
-
108
-
109
-
110
-
111
-
112
-
113
-
114
-
115
-
116
-
117
-
118
-
119
-
120
-
121
-
122
-
123
-
124
-
125
-
126
-
127
-
128
-
129
-
130
-
131
-
132
-
133
-
134
-
135
-
136
-
137
-
138
-
139
-
140
-
141
-
142
-
143
-
144
-
145
-
146
-
147
-
 148
148 -
 149
149 -
 150
150 -
 151
151 -
 152
152 -
 153
153 -
 154
154 -
 155
155 -
 156
156 -
 157
157 -
 158
158 -
 159
159 -
 160
160 -
 161
161 -
 162
162 -
 163
163 -
 164
164 -
 165
165 -
 166
166 -
 167
167 -
 168
168 -
169
-
170
-
171
-
172
-
173
-
174
-
175
-
176
-
177
-
178
-
179
-
180
-
181
-
182
-
183
-
184
-
185
-
186
-
187
-
188
-
189
-
190
-
191
-
192
-
193
-
194
-
195
-
196
-
197
-
198
-
199
-
200
-
201
-
202
-
203
-
204
-
205
-
206
-
207
-
208
-
209
-
210
-
211
-
212
-
213
-
214
-
215
-
216
-
217
-
218
-
219
-
220
-
221
-
222
-
223
-
224
-
225
-
226
-
227
-
228
-
229
-
230
-
231
-
232
-
233
-
234
-
235
-
236
-
237
-
238
-
239
-
240
-
241
-
242
-
243
-
244
-
245
-
246
-
247
-
248
-
249
-
250
-
251
-
252
 |
 |

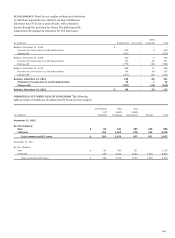
Note 6: Loans and Allowance for Credit Losses (continued)
The following table provides the outstanding balances of our consumer portfolio by delinquency status.
Real estate Real estate Other
1-4 family 1-4 family revolving
first junior lien Credit credit and
(in millions) mortgage mortgage card installment Total
December 31, 2012
By delinquency status:
Current-29 DPD $ 179,870 73,256 23,976 74,519 351,621
30-59 DPD 3,295 577 211 966 5,049
60-89 DPD 1,528 339 143 272 2,282
90-119 DPD 853 265 122 130 1,370
120-179 DPD 1,141 358 187 33 1,719
180+ DPD 6,655 518 1 5 7,179
Government insured/guaranteed loans (1) 29,719 - - 12,446 42,165
Total consumer loans (excluding PCI) 223,061 75,313 24,640 88,371 411,385
Total consumer PCI loans (carrying value) 26,839 152 - - 26,991
Total consumer loans $ 249,900 75,465 24,640 88,371 438,376
December 31, 2011
By delinquency status:
Current-29 DPD $ 156,985 83,033 22,125 69,712 331,855
30-59 DPD 4,075 786 211 963 6,035
60-89 DPD 2,012 501 154 275 2,942
90-119 DPD 1,152 382 135 127 1,796
120-179 DPD 1,704 537 211 33 2,485
180+ DPD 6,665 546 - 4 7,215
Government insured/guaranteed loans (1) 26,555 - - 15,346 41,901
Total consumer loans (excluding PCI) 199,148 85,785 22,836 86,460 394,229
Total consumer PCI loans (carrying value) 29,746 206 - - 29,952
Total consumer loans $ 228,894 85,991 22,836 86,460 424,181
(1) Represents loans whose repayments are predominantly insured by the FHA or guaranteed by the VA and student loans whose repayments are predominantly guaranteed by
agencies on behalf of the U.S. Department of Education under the Federal Family Education Loan Program (FFELP). Loans insured/guaranteed by the FHA/VA and 90+ DPD
totaled $20.2 billion at December 31, 2012, compared with $18.5 billion at December 31, 2011. Student loans 90+ DPD totaled $1.1 billion at December 31, 2012,
compared with $1.3 billion at December 31, 2011.
Of the $10.3 billion of loans not government
insured/guaranteed that are 90 days or more past due at
December 31, 2012, $1.1 billion was accruing, compared with
$11.5 billion past due and $1.5 billion accruing at
December 31, 2011.
Real estate 1-4 family first mortgage loans 180 days or more
past due totaled $6.7 billion, or 3.0% of total first mortgages
(excluding PCI), at December 31, 2012, compared with
$6.7 billion, or 3.3%, at December 31, 2011.
The following table provides a breakdown of our consumer
portfolio by updated FICO. We obtain FICO scores at loan
origination and the scores are updated at least quarterly. The
majority of our portfolio is underwritten with a FICO score of
680 and above. FICO is not available for certain loan types and
may not be obtained if we deem it unnecessary due to strong
collateral and other borrower attributes, primarily securities-
based margin loans of $5.4 billion at December 31, 2012, and
$5.0 billion at December 31, 2011.
156