Wells Fargo 2012 Annual Report Download - page 5
Download and view the complete annual report
Please find page 5 of the 2012 Wells Fargo annual report below. You can navigate through the pages in the report by either clicking on the pages listed below, or by using the keyword search tool below to find specific information within the annual report.-
 1
1 -
 2
2 -
 3
3 -
 4
4 -
 5
5 -
 6
6 -
 7
7 -
 8
8 -
 9
9 -
 10
10 -
 11
11 -
 12
12 -
 13
13 -
 14
14 -
 15
15 -
 16
16 -
17
-
18
-
19
-
20
-
21
-
22
-
23
-
24
-
25
-
26
-
27
-
28
-
29
-
30
-
31
-
32
-
33
-
34
-
35
-
36
-
37
-
38
-
39
-
40
-
41
-
42
-
43
-
44
-
45
-
46
-
47
-
48
-
49
-
50
-
51
-
52
-
53
-
54
-
55
-
56
-
57
-
58
-
59
-
60
-
61
-
62
-
63
-
64
-
65
-
66
-
67
-
68
-
69
-
70
-
71
-
72
-
73
-
74
-
75
-
76
-
77
-
78
-
79
-
80
-
81
-
82
-
83
-
84
-
85
-
86
-
87
-
88
-
89
-
90
-
91
-
92
-
93
-
94
-
95
-
96
-
97
-
98
-
99
-
100
-
101
-
102
-
103
-
104
-
105
-
106
-
107
-
108
-
109
-
110
-
111
-
112
-
113
-
114
-
115
-
116
-
117
-
118
-
119
-
120
-
121
-
122
-
123
-
124
-
125
-
126
-
127
-
128
-
129
-
130
-
131
-
132
-
133
-
134
-
135
-
136
-
137
-
138
-
139
-
140
-
141
-
142
-
143
-
144
-
145
-
146
-
147
-
148
-
149
-
150
-
151
-
152
-
153
-
154
-
155
-
156
-
157
-
158
-
159
-
160
-
161
-
162
-
163
-
164
-
165
-
166
-
167
-
168
-
169
-
170
-
171
-
172
-
173
-
174
-
175
-
176
-
177
-
178
-
179
-
180
-
181
-
182
-
183
-
184
-
185
-
186
-
187
-
188
-
189
-
190
-
191
-
192
-
193
-
194
-
195
-
196
-
197
-
198
-
199
-
200
-
201
-
202
-
203
-
204
-
205
-
206
-
207
-
208
-
209
-
210
-
211
-
212
-
213
-
214
-
215
-
216
-
217
-
218
-
219
-
220
-
221
-
222
-
223
-
224
-
225
-
226
-
227
-
228
-
229
-
230
-
231
-
232
-
233
-
234
-
235
-
236
-
237
-
238
-
239
-
240
-
241
-
242
-
243
-
244
-
245
-
246
-
247
-
248
-
249
-
250
-
251
-
252
 |
 |
Our focus on customers and serving them well drove
another year of record results in2012 for WellsFargo and
our stakeholders.
2012: Continued financial success
We delivered net income of $18.9billion in2012, up
19percent from 2011. This fourth consecutive year of
record profit reflected the time-tested virtues of our
diversified business model and our focus on growing
revenue and managing costs and risks— no matter how
dicult the operating environment. We grew our core
loans and deposits, despite an uneven economic recovery,
and grew revenue in a low interest rate environment that
pressured our margins. Each of our primary business
segments grew its full-year segment net income year
over year: Community Banking by 15percent, Wholesale
Banking by 11percent, and Wealth, Brokerage and
Retirement by 4percent.
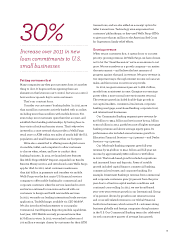
In2012, WellsFargo led in areas central to our
customers’ lives and our economy’s vitality— small
business lending, home mortgage lending, auto lending,
and private student lending. We provided a safe and
sound place for our customers to hold and manage their
financial assets, and served our customers eciently
and conveniently through the nation’s most extensive
network of banking stores, more than 12,000 ATMs, our
24-hour-a-day WellsFargo Customer ConnectionSM, and
our industry-leading online and mobile presence.
Just as important, we accomplished this with a cross-
sell strategy that continues to distinguish WellsFargo
as a leader in building customer relationships. It’s as
simple as this: The better we know our customers, the
more opportunities we have to provide them with the
products and services they need. In2012, that mindset
produced records in the average number of WellsFargo
products per customer. At the end of the fourth quarter,
the average Retail Bank household had more than
six products, our average Wholesale Bank customer
had nearly seven products, and our average Wealth,
Brokerage and Retirement customer had 10products!
Another measure of our success: deposit and
loan growth. Since completing our 2008 merger with
Wachovia Corp., WellsFargo has grown deposits by more
than $221billion and core loans by $31billion. Frankly,
there’s no better proof of customer confidence in today’s
WellsFargo and our unique opportunity to grow.
In2012, we continued to produce value for our
shareholders. Our return on assets was 1.41percent, our
return on equity was 12.95percent, and our full-year
earnings-per-share growth was 19percent. In2012, we
also returned more capital to our shareholders, as we
increased our regular quarterly dividend by 83percent
to 22cents per share and purchased 119million shares
of the company’s common stock. On Jan.22, 2013, we
raised our regular quarterly dividend again, an increase
of 14percent to 25cents per share. WellsFargo finished
the year with an industry-leading market capitalization
of $180billion (ourstock price multiplied by the number
ofshares outstanding).
WellsFargo’s full-year income was equally balanced
between net interest income and noninterest income,
a balance that has come to typify a core benefit of our
business model that makes growth an attainable goal in
a variety of interest rate environments. Indeed, in2012,
WellsFargo’s net interest income grew by $467million,
or 1percent, to $43.2billion. This was achieved despite
low interest rates that put pressure on our margins,
aswe delivered more products and services to customers
acrossour huge deposit base.
Meanwhile, we reduced credit losses to $9.0billion,
down $2.3billion, or 20percent, from $11.3billion in2011.
Our capital position also improved. WellsFargo
finished 2012 with Tier1 common equity1 of $109.1billion,
up 15percent from $95.1billion a year ago, resulting in a
Tier1 common equity ratio of 10.12percent under BaselI.
Helping an economy in transition
In conversation after conversation last year— across
kitchen tables, as well as conference room tables— we
heard of signs of a strengthening U.S. economy. Still, we
also observed the worries and uncertainty that influenced
consumer and business behaviors in many areas of the
country and the economy. Yes, low interest rates oered
acompelling opportunity to get household balance sheets
in order. And there were bright spots, such as energy,
that reminded us of the advantages our U.S. economy
still holds. But overall, our customers remained cautious
given the economy’s tepid growth and headlines about
Washington gridlock, budget pressures, and higher taxes.
So, while we remain optimistic for continued economic
expansion in2013, we do so guardedly, based on what we
experienced in2012.
1Please see the “Financial Review – Capital Management” section in this Report
formoreinformation.