eBay 2001 Annual Report Download - page 29
Download and view the complete annual report
Please find page 29 of the 2001 eBay annual report below. You can navigate through the pages in the report by either clicking on the pages listed below, or by using the keyword search tool below to find specific information within the annual report.-
 1
1 -
2
-
3
-
4
-
5
-
6
-
7
-
8
-
9
-
10
-
11
-
12
-
13
-
14
-
15
-
16
-
17
-
18
-
 19
19 -
 20
20 -
 21
21 -
 22
22 -
 23
23 -
 24
24 -
 25
25 -
 26
26 -
 27
27 -
 28
28 -
 29
29 -
 30
30 -
 31
31 -
 32
32 -
 33
33 -
 34
34 -
 35
35 -
 36
36 -
 37
37 -
 38
38 -
 39
39 -
40
-
41
-
42
-
43
-
44
-
45
-
46
-
47
-
48
-
49
-
50
-
51
-
52
-
53
-
54
-
55
-
56
-
57
-
58
-
59
-
60
-
61
-
62
-
63
-
64
-
65
-
66
-
67
-
68
-
69
-
70
-
71
-
72
-
73
-
74
-
75
-
76
-
77
-
78
-
79
-
80
-
81
-
82
-
83
-
84
-
85
-
86
-
87
-
88
-
89
-
90
-
91
-
92
-
93
-
94
-
95
-
96
-
97
-
98
-
99
-
100
-
101
 |
 |

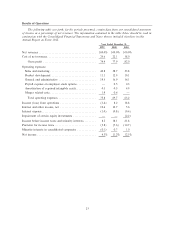
Revenues from third-party advertising increased primarily as a result of our strategy to increase overall
site monetization and through the eÅorts of AOL Time Warner, Inc., our exclusive advertising sales
representative. However, we continue to view our business as primarily transaction driven and we expect
third-party advertising revenues in future periods to decrease as a percentage of total net revenues, and
possibly in absolute dollars.
Revenues from end-to-end services and promotions decreased from 7% of net revenues for the year
ended December 31, 2000, to 4% of net revenues for 2001, and include various amounts received from
third parties that provide transaction services to eBay users. At this time, we expect end-to-end services
and promotions revenues in future periods to decrease as a percentage of total net revenues and possibly in
absolute dollars.
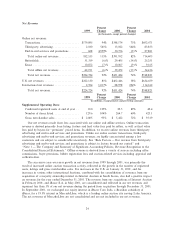
International net revenues have grown as a percentage of consolidated net revenues. This growth is
primarily the result of strong performance in Germany, Canada and the United Kingdom, and additional
revenues from our acquisition of a majority interest in Internet Auction in South Korea. We expect the
trend of increasing international net revenues to continue as we continue the development and deployment
of our global marketplace.
During the year ended December 31, 2001, oÉine revenues have decreased in both absolute dollars
and as a percentage of net revenues compared to 2000, primarily as a result of a general softening in the
oÉine auction and high-end art markets.
We expect that our online business will continue to represent the majority of revenue growth in the
foreseeable future.
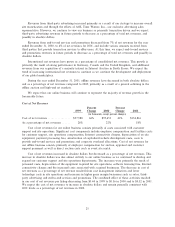
Cost of Net Revenues
Percent Percent
1999 Change 2000 Change 2001
(in thousands, except percent changes)
Cost of net revenues ÏÏÏÏÏÏÏÏÏÏÏÏÏÏÏÏ $57,588 66% $95,453 41% $134,816
As a percentage of net revenues ÏÏÏÏÏÏ 26% 22% 18%
Cost of net revenues for our online business consists primarily of costs associated with customer
support and site operations. SigniÑcant cost components include employee compensation and facilities costs
for customer support, site operations compensation, Internet connectivity charges, depreciation of on-site
equipment, payment processing fees, amortization of capitalized website development costs, costs to
provide end-to-end services and promotions and corporate overhead allocations. Cost of net revenues for
our oÉine business consists primarily of employee compensation for auction, appraisal and customer
support personnel as well as direct auction costs such as event site rental.
Cost of net revenues increased in absolute dollars but decreased as a percentage of net revenues. This
increase in absolute dollars was due almost entirely to our online business as we continued to develop and
expand our customer support and site operations departments. The increases were primarily the result of
personnel costs, depreciation of the equipment required for site operations, software licensing fees, Internet
connectivity charges and the increased costs associated with acquired businesses. The decrease in cost of
net revenues as a percentage of net revenue resulted from cost management initiatives and lower
technology costs in site operations and increases in higher gross margin businesses such as autos, third-
party advertising and end-to-end services and promotions. The combined eÅect of these activities resulted
in our cost of net revenues per listing decreasing from $0.44 in 1999 to $0.36 in 2000 and to $0.32 in 2001.
We expect the cost of net revenues to increase in absolute dollars and remain generally consistent with
2001 levels as a percentage of net revenues in 2002.
25