eBay 2001 Annual Report Download - page 99
Download and view the complete annual report
Please find page 99 of the 2001 eBay annual report below. You can navigate through the pages in the report by either clicking on the pages listed below, or by using the keyword search tool below to find specific information within the annual report.-
 1
1 -
2
-
3
-
4
-
5
-
6
-
7
-
8
-
9
-
10
-
11
-
12
-
13
-
14
-
15
-
16
-
17
-
18
-
19
-
20
-
21
-
22
-
23
-
24
-
25
-
26
-
27
-
28
-
29
-
30
-
31
-
32
-
33
-
34
-
35
-
36
-
37
-
38
-
39
-
40
-
41
-
42
-
43
-
44
-
45
-
46
-
47
-
48
-
49
-
50
-
51
-
52
-
53
-
54
-
55
-
56
-
57
-
58
-
59
-
60
-
61
-
62
-
63
-
64
-
65
-
66
-
67
-
68
-
69
-
70
-
71
-
72
-
73
-
74
-
75
-
76
-
77
-
78
-
79
-
80
-
81
-
82
-
83
-
84
-
85
-
86
-
87
-
88
-
 89
89 -
 90
90 -
 91
91 -
 92
92 -
 93
93 -
 94
94 -
 95
95 -
 96
96 -
 97
97 -
 98
98 -
 99
99 -
 100
100 -
 101
101
 |
 |

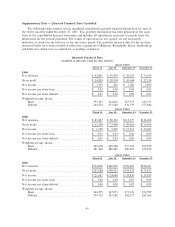
Supplementary Data Ì Quarterly Financial Data-Unaudited:
The following tables present certain unaudited consolidated quarterly Ñnancial information for each of
the twelve quarters ended December 31, 2001. This quarterly information has been prepared on the same
basis as the consolidated Ñnancial statements and includes all adjustments necessary to present fairly the
information for the periods presented. The results of operations for any quarter are not necessarily
indicative of results for the full year or for any future period. The quarterly Ñnancial data for the quarters
presented below have been restated to reÖect the acquisitions of Billpoint, ButterÑelds, Kruse, alando.de.ag
and Half.com, which were accounted for as poolings of interest.
Quarterly Financial Data
(unaudited, in thousands, except per share amounts)
Quarter Ended
March 31 June 30 September 30 December 31
1999
Net revenues ÏÏÏÏÏÏÏÏÏÏÏÏÏÏÏÏÏÏÏÏÏÏÏÏÏÏÏÏÏÏÏÏÏÏÏ $ 42,801 $ 49,479 $ 58,525 $ 73,919
Gross proÑtÏÏÏÏÏÏÏÏÏÏÏÏÏÏÏÏÏÏÏÏÏÏÏÏÏÏÏÏÏÏÏÏÏÏÏÏÏ $ 34,824 $ 38,534 $ 41,444 $ 52,334
Net income ÏÏÏÏÏÏÏÏÏÏÏÏÏÏÏÏÏÏÏÏÏÏÏÏÏÏÏÏÏÏÏÏÏÏÏÏ $ 3,765 $ 816 $ 1,186 $ 3,800
Net income per share-basic ÏÏÏÏÏÏÏÏÏÏÏÏÏÏÏÏÏÏÏÏÏÏÏ $ 0.02 $ 0.00 $ 0.01 $ 0.02
Net income per share-diluted ÏÏÏÏÏÏÏÏÏÏÏÏÏÏÏÏÏÏÏÏÏ $ 0.01 $ 0.00 $ 0.00 $ 0.01
Weighted-average shares:
Basic ÏÏÏÏÏÏÏÏÏÏÏÏÏÏÏÏÏÏÏÏÏÏÏÏÏÏÏÏÏÏÏÏÏÏÏÏÏÏ 195,363 214,062 227,975 233,125
Diluted ÏÏÏÏÏÏÏÏÏÏÏÏÏÏÏÏÏÏÏÏÏÏÏÏÏÏÏÏÏÏÏÏÏÏÏÏ 264,654 273,580 276,179 277,844
Quarter Ended
March 31 June 30 September 30 December 31
2000
Net revenues ÏÏÏÏÏÏÏÏÏÏÏÏÏÏÏÏÏÏÏÏÏÏÏÏÏÏÏÏÏÏÏÏÏÏÏ $ 85,887 $ 98,152 $113,377 $134,008
Gross proÑtÏÏÏÏÏÏÏÏÏÏÏÏÏÏÏÏÏÏÏÏÏÏÏÏÏÏÏÏÏÏÏÏÏÏÏÏÏ $ 62,504 $ 73,948 $ 89,465 $110,054
Net income ÏÏÏÏÏÏÏÏÏÏÏÏÏÏÏÏÏÏÏÏÏÏÏÏÏÏÏÏÏÏÏÏÏÏÏÏ $ 1,758 $ 7,459 $ 15,211 $ 23,865
Net income per share-basic ÏÏÏÏÏÏÏÏÏÏÏÏÏÏÏÏÏÏÏÏÏÏÏ $ 0.01 $ 0.03 $ 0.06 $ 0.09
Net income per share-diluted ÏÏÏÏÏÏÏÏÏÏÏÏÏÏÏÏÏÏÏÏÏ $ 0.01 $ 0.03 $ 0.05 $ 0.09
Weighted-average shares:
Basic ÏÏÏÏÏÏÏÏÏÏÏÏÏÏÏÏÏÏÏÏÏÏÏÏÏÏÏÏÏÏÏÏÏÏÏÏÏÏ 242,658 249,828 255,741 259,789
Diluted ÏÏÏÏÏÏÏÏÏÏÏÏÏÏÏÏÏÏÏÏÏÏÏÏÏÏÏÏÏÏÏÏÏÏÏÏ 281,344 280,483 280,297 279,822
Quarter Ended
March 31 June 30 September 30 December 31
2001
Net revenues ÏÏÏÏÏÏÏÏÏÏÏÏÏÏÏÏÏÏÏÏÏÏÏÏÏÏÏÏÏÏÏÏÏÏÏ $154,090 $180,905 $194,425 $219,401
Gross proÑtÏÏÏÏÏÏÏÏÏÏÏÏÏÏÏÏÏÏÏÏÏÏÏÏÏÏÏÏÏÏÏÏÏÏÏÏÏ $127,088 $148,033 $159,472 $179,412
Net income ÏÏÏÏÏÏÏÏÏÏÏÏÏÏÏÏÏÏÏÏÏÏÏÏÏÏÏÏÏÏÏÏÏÏÏÏ $ 21,067 $ 24,608 $ 18,838 $ 25,935
Net income per share-basic ÏÏÏÏÏÏÏÏÏÏÏÏÏÏÏÏÏÏÏÏÏÏÏ $ 0.08 $ 0.09 $ 0.07 $ 0.09
Net income per share-diluted ÏÏÏÏÏÏÏÏÏÏÏÏÏÏÏÏÏÏÏÏÏ $ 0.08 $ 0.09 $ 0.07 $ 0.09
Weighted-average shares:
Basic ÏÏÏÏÏÏÏÏÏÏÏÏÏÏÏÏÏÏÏÏÏÏÏÏÏÏÏÏÏÏÏÏÏÏÏÏÏÏ 264,279 267,075 271,236 274,599
Diluted ÏÏÏÏÏÏÏÏÏÏÏÏÏÏÏÏÏÏÏÏÏÏÏÏÏÏÏÏÏÏÏÏÏÏÏÏ 278,732 283,582 282,317 283,564
95