eBay 2006 Annual Report Download - page 43
Download and view the complete annual report
Please find page 43 of the 2006 eBay annual report below. You can navigate through the pages in the report by either clicking on the pages listed below, or by using the keyword search tool below to find specific information within the annual report.-
 1
1 -
2
-
3
-
4
-
5
-
6
-
7
-
8
-
9
-
10
-
11
-
12
-
13
-
14
-
15
-
16
-
17
-
18
-
19
-
20
-
21
-
22
-
23
-
24
-
25
-
26
-
27
-
28
-
29
-
30
-
31
-
32
-
 33
33 -
 34
34 -
 35
35 -
 36
36 -
 37
37 -
 38
38 -
 39
39 -
 40
40 -
 41
41 -
 42
42 -
 43
43 -
 44
44 -
 45
45 -
 46
46 -
 47
47 -
 48
48 -
 49
49 -
 50
50 -
 51
51 -
 52
52 -
 53
53 -
54
-
55
-
56
-
57
-
58
-
59
-
60
-
61
-
62
-
63
-
64
-
65
-
66
-
67
-
68
-
69
-
70
-
71
-
72
-
73
-
74
-
75
-
76
-
77
-
78
-
79
-
80
-
81
-
82
-
83
-
84
-
85
-
86
-
87
-
88
-
89
-
90
-
91
-
92
-
93
-
94
-
95
-
96
-
97
-
98
-
99
-
100
-
101
-
102
-
103
-
104
-
105
-
106
-
107
-
108
-
109
-
110
-
111
-
112
-
113
-
114
 |
 |

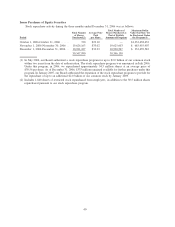
2002, exercised options to purchase 1,430,000 shares in 2003, exercised options to purchase 307,272 shares during
2005 and exercised options to purchase 614,544 shares during 2006. As of December 31, 2006, options to purchase
768,184 shares remain outstanding under the non-plan grant.
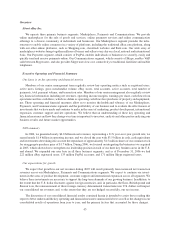
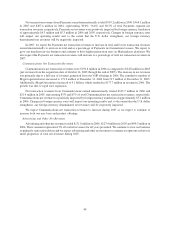
Performance Measurement Comparison
The graph below shows the cumulative total stockholder return of an investment of $100 (and the reinvestment
of any dividends thereafter) on December 31, 2001 in (i) our common stock, (ii) the Nasdaq National Market Index,
(iii) the S&P 500 Index and (iv) the GSTI Internet Index. We were added to the S&P 500 Index on July 19, 2002. The
GSTI Internet Index is a modified-capitalization weighted index of 14 stocks representing the Internet industry,
including Internet content and access providers, Internet software and service companies and e-commerce
companies. Our stock price performance shown in the graph below is not indicative of future stock price
performance.
The following graph and related information shall not be deemed “soliciting material” or be deemed to be
“filed” with the SEC, nor shall such information be incorporated by reference into any future filing, except to the
extent that we specifically incorporate it by reference into such filing.
eBay GSTI Internet Index Nasdaq Composite Index S&P 500 Index
Aug-02
Oct-02
Oct-03
Dec-02
Feb-03
Apr-03
Jun-03
Aug-03
Dec-03
Feb-04
Apr-04
Jun-04
Aug-04
Dec-04
Feb-05
Apr-05
Jun-05
Aug-05
Oct-04
Oct-05
Oct-06
Feb-06
Apr-06
Jun-06
Aug-06
Dec-06
Dec-05
Dec-01
Feb-02
Apr-02
Jun-02
$0
$50
$100
$150
$200
$250
$300
$350
$400
39