eBay 2006 Annual Report Download - page 55
Download and view the complete annual report
Please find page 55 of the 2006 eBay annual report below. You can navigate through the pages in the report by either clicking on the pages listed below, or by using the keyword search tool below to find specific information within the annual report.-
 1
1 -
2
-
3
-
4
-
5
-
6
-
7
-
8
-
9
-
10
-
11
-
12
-
13
-
14
-
15
-
16
-
17
-
18
-
19
-
20
-
21
-
22
-
23
-
24
-
25
-
26
-
27
-
28
-
29
-
30
-
31
-
32
-
33
-
34
-
35
-
36
-
37
-
38
-
39
-
40
-
41
-
42
-
43
-
44
-
 45
45 -
 46
46 -
 47
47 -
 48
48 -
 49
49 -
 50
50 -
 51
51 -
 52
52 -
 53
53 -
 54
54 -
 55
55 -
 56
56 -
 57
57 -
 58
58 -
 59
59 -
 60
60 -
 61
61 -
 62
62 -
 63
63 -
 64
64 -
 65
65 -
66
-
67
-
68
-
69
-
70
-
71
-
72
-
73
-
74
-
75
-
76
-
77
-
78
-
79
-
80
-
81
-
82
-
83
-
84
-
85
-
86
-
87
-
88
-
89
-
90
-
91
-
92
-
93
-
94
-
95
-
96
-
97
-
98
-
99
-
100
-
101
-
102
-
103
-
104
-
105
-
106
-
107
-
108
-
109
-
110
-
111
-
112
-
113
-
114
 |
 |

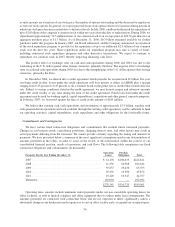
marketing rates, partially offset by marketing efficiencies. Employee-related costs increased by $97.4 million in
2005 as we continued to expand our domestic and international operations.
Sales and marketing expenses are expected to increase in total during 2007 because of expected increases in
our online marketing expense to attract new customers and increase user activity across our businesses. Sales and
marketing expenses as a percentage of net revenues are expected to decrease during 2007 due to the growth in
Payments and Communications, each of which, has lower sales and marketing expenses than Marketplaces.
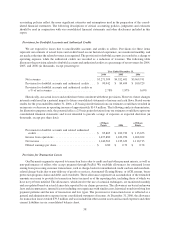
Product Development
2004 2005 2006
(In thousands, except percentages)
Product development ................................ $240,647 $328,191 $494,695
As a percentage of net revenues ........................ 7.4% 7.2% 8.3%
Product development expenses consist primarily of employee compensation, consultant costs, facilities costs
and depreciation on equipment. Product development expenses are net of required capitalization of major site and
other product development efforts, including the development of our next generation platform architecture,
migration of certain platforms, seller tools and PayPal services integration projects. These capitalized costs totaled
$67.9 million in 2006, $37.1 million in 2005 and $41.3 million in 2004, and are reflected as a cost of net revenues
when amortized in future periods.
The increase in product development expense of $166.5 million during 2006 was primarily due to employees
added, including contractors and consultants, to support various platform and software development initiatives in
our Marketplaces, Payments and Communications segments and the effect of stock-based compensation expense
related to employee stock options and employee stock purchases under FAS 123(R). Employee related and
consultant costs, excluding stock-based compensation, increased by approximately $61.5 million in 2006 compared
to the prior year. Our product development staff increased from approximately 2,200 at December 31, 2005 to
approximately 2,500 at December 31, 2006. Stock-based compensation expense of $81.5 million was included in
product development expense in 2006 compared to $6.5 million in 2005. Stock-based compensation expense
increased due to our implementation of FAS 123(R) at the beginning of 2006.
The increase in product development expenses in 2005, as compared to the prior year, was primarily the result
of increased headcount to support various platform development initiatives in our Marketplaces, Payments and
Communications segments. Employee related costs increased by $63.9 million compared to the prior year. Our
product development staff increased nearly 50% from approximately 1,500 at December 31, 2004 to approximately
2,200 at December 31, 2005.
Product development expenses are expected to increase in total and remain consistent as a percentage of net
revenues in 2007, as we develop new site features and functionality and continue to improve and expand operations
across all businesses.
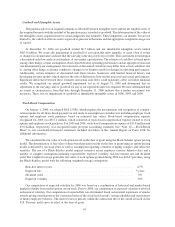
General and Administrative
2004 2005 2006
(In thousands, except percentages)
General and administrative ............................ $475,614 $649,529 $978,363
As a percentage of net revenues ........................ 14.5% 14.3% 16.4%
General and administrative expenses consist primarily of employee compensation, consultant costs, provisions
for transaction losses associated with our Payments segment, facilities costs, depreciation of equipment, provision
for doubtful accounts, payroll taxes on employee stock options, insurance and professional fees.
The increase in general and administrative expenses of $328.8 million during 2006 was primarily due to
increased employee-related costs, consultant costs, higher Payments transaction loss expenses, and the effect of
stock-based compensation expense related to employee stock options and employee stock purchases under
FAS 123(R). Employee-related costs and consultant costs increased by approximately $112.6 million during
2006 as compared to the prior year due to our continued focus on user protection programs. We increased our
general and administrative employee headcount from approximately 4,200 at December 31, 2005 to 4,900 at
51