Baskin Robbins 2015 Annual Report Download - page 100
Download and view the complete annual report
Please find page 100 of the 2015 Baskin Robbins annual report below. You can navigate through the pages in the report by either clicking on the pages listed below, or by using the keyword search tool below to find specific information within the annual report.-
 1
1 -
2
-
3
-
4
-
5
-
6
-
7
-
8
-
9
-
10
-
11
-
12
-
13
-
14
-
15
-
16
-
17
-
18
-
19
-
20
-
21
-
22
-
23
-
24
-
25
-
26
-
27
-
28
-
29
-
30
-
31
-
32
-
33
-
34
-
35
-
36
-
37
-
38
-
39
-
40
-
41
-
42
-
43
-
44
-
45
-
46
-
47
-
48
-
49
-
50
-
51
-
52
-
53
-
54
-
55
-
56
-
57
-
58
-
59
-
60
-
61
-
62
-
63
-
64
-
65
-
66
-
67
-
68
-
69
-
70
-
71
-
72
-
73
-
74
-
75
-
76
-
77
-
78
-
79
-
80
-
81
-
82
-
83
-
84
-
85
-
86
-
87
-
88
-
89
-
 90
90 -
 91
91 -
 92
92 -
 93
93 -
 94
94 -
 95
95 -
 96
96 -
 97
97 -
 98
98 -
 99
99 -
 100
100 -
 101
101 -
 102
102 -
 103
103 -
 104
104 -
 105
105 -
 106
106 -
 107
107 -
 108
108 -
 109
109 -
 110
110 -
111
-
112
 |
 |

-90-
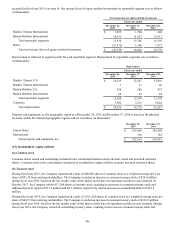
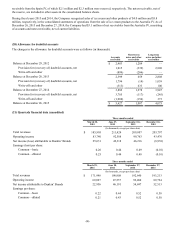
receivable from the Spain JV, of which $2.1 million and $2.3 million were reserved, respectively. The notes receivable, net of
the reserve, are included in other assets in the consolidated balance sheets.
During fiscal years 2015 and 2014, the Company recognized sales of ice cream and other products of $4.0 million and $5.8
million, respectively, in the consolidated statements of operations from the sale of ice cream products to the Australia JV. As of
December 26, 2015 and December 27, 2014, the Company had $3.1 million of net receivables from the Australia JV, consisting
of accounts and notes receivable, net of current liabilities.
(20) Allowance for doubtful accounts
The changes in the allowance for doubtful accounts were as follows (in thousands):
Accounts
receivable
Short-term
notes and other
receivables
Long-term
notes and other
receivables
Balance at December 29, 2012 $ 2,483 1,204 —
Provision for (recovery of) doubtful accounts, net 1,015 (339) 2,808
Write-offs and other (899)(206)—
Balance at December 28, 2013 2,599 659 2,808
Provision for (recovery of) doubtful accounts, net 1,796 (14) 1,039
Write-offs and other (513) 633 100
Balance at December 27, 2014 3,882 1,278 3,947
Provision for (recovery of) doubtful accounts, net 3,705 (117)(245)
Write-offs and other (1,960)(154) 373
Balance at December 26, 2015 $ 5,627 1,007 4,075
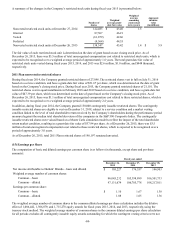
(21) Quarterly financial data (unaudited)
Three months ended
March 28,
2015
June 27,
2015
September 26,
2015
December 26,
2015
(In thousands, except per share data)
Total revenues $ 185,905 211,424 209,807 203,797
Operating income 83,740 92,588 99,763 43,476
Net income (loss) attributable to Dunkin’ Brands 25,631 42,318 46,216 (8,938)
Earnings (loss) per share:
Common—basic 0.26 0.44 0.49 (0.10)
Common—diluted 0.25 0.44 0.48 (0.10)
Three months ended
March 29,
2014
June 28,
2014
September 27,
2014
December 27,
2014
(In thousands, except per share data)
Total revenues $ 171,948 190,908 192,640 193,213
Operating income 69,097 87,557 92,480 89,724
Net income attributable to Dunkin’ Brands 22,956 46,191 54,697 52,513
Earnings per share:
Common—basic 0.22 0.44 0.52 0.50
Common—diluted 0.21 0.43 0.52 0.50