Baskin Robbins 2015 Annual Report Download - page 88
Download and view the complete annual report
Please find page 88 of the 2015 Baskin Robbins annual report below. You can navigate through the pages in the report by either clicking on the pages listed below, or by using the keyword search tool below to find specific information within the annual report.-
 1
1 -
2
-
3
-
4
-
5
-
6
-
7
-
8
-
9
-
10
-
11
-
12
-
13
-
14
-
15
-
16
-
17
-
18
-
19
-
20
-
21
-
22
-
23
-
24
-
25
-
26
-
27
-
28
-
29
-
30
-
31
-
32
-
33
-
34
-
35
-
36
-
37
-
38
-
39
-
40
-
41
-
42
-
43
-
44
-
45
-
46
-
47
-
48
-
49
-
50
-
51
-
52
-
53
-
54
-
55
-
56
-
57
-
58
-
59
-
60
-
61
-
62
-
63
-
64
-
65
-
66
-
67
-
68
-
69
-
70
-
71
-
72
-
73
-
74
-
75
-
76
-
77
-
 78
78 -
 79
79 -
 80
80 -
 81
81 -
 82
82 -
 83
83 -
 84
84 -
 85
85 -
 86
86 -
 87
87 -
 88
88 -
 89
89 -
 90
90 -
 91
91 -
 92
92 -
 93
93 -
 94
94 -
 95
95 -
 96
96 -
 97
97 -
 98
98 -
99
-
100
-
101
-
102
-
103
-
104
-
105
-
106
-
107
-
108
-
109
-
110
-
111
-
112
 |
 |

-78-
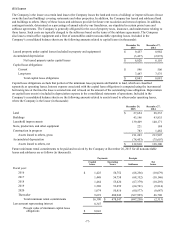
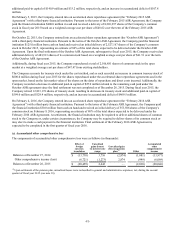
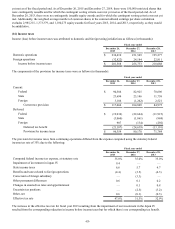
Rental expense under operating leases associated with franchised locations and company-operated locations is included in
occupancy expenses—franchised restaurants and company-operated restaurant expenses, respectively, in the consolidated
statements of operations. Rental expense under operating leases for all other locations, including corporate facilities, is included
in general and administrative expenses, net, in the consolidated statements of operations. Total rental expense for all operating
leases consisted of the following (in thousands):
Fiscal year ended
December 26,
2015
December 27,
2014
December 28,
2013
Base rentals $ 54,290 53,130 53,462
Contingent rentals 6,348 6,071 5,869
Total rental expense $ 60,638 59,201 59,331
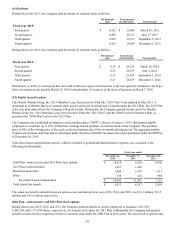
Total rental income for all leases and subleases consisted of the following (in thousands):
Fiscal year ended
December 26,
2015
December 27,
2014
December 28,
2013
Base rentals $ 70,033 67,945 66,540
Contingent rentals 30,389 29,718 29,542
Total rental income $ 100,422 97,663 96,082
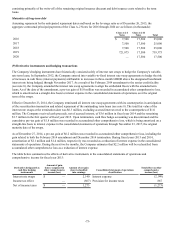
The impact of the amortization of our unfavorable operating leases acquired resulted in an increase in rental income and a
decrease in rental expense as follows (in thousands):
Fiscal year ended
December 26,
2015
December 27,
2014
December 28,
2013
Increase in rental income $ 793 847 973
Decrease in rental expense 982 1,188 1,204
Total increase in operating income $ 1,775 2,035 2,177
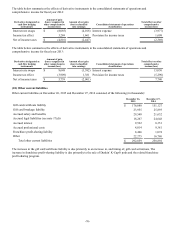
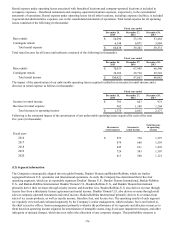
Following is the estimated impact of the amortization of our unfavorable operating leases acquired for each of the next
five years (in thousands):
Decrease in
rental expense
Increase in
rental income
Total increase
in operating
income
Fiscal year:
2016 $ 879 718 1,597
2017 879 680 1,559
2018 845 631 1,476
2019 724 583 1,307
2020 613 508 1,121
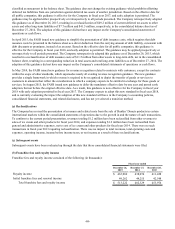
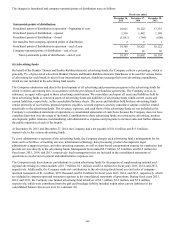
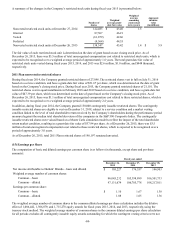
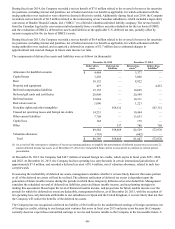
(12) Segment information
The Company is strategically aligned into two global brands, Dunkin’ Donuts and Baskin-Robbins, which are further
segregated between U.S. operations and international operations. As such, the Company has determined that it has four
operating segments, which are its reportable segments: Dunkin’ Donuts U.S., Dunkin’ Donuts International, Baskin-Robbins
U.S., and Baskin-Robbins International. Dunkin’ Donuts U.S., Baskin-Robbins U.S., and Dunkin’ Donuts International
primarily derive their revenues through royalty income and franchise fees. Baskin-Robbins U.S. also derives revenue through
license fees from a third-party license agreement and rental income. Dunkin’ Donuts U.S. also derives revenue through retail
sales at company-operated restaurants and rental income. Baskin-Robbins International primarily derives its revenues from
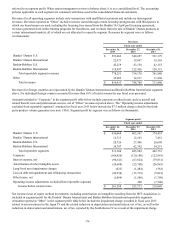
sales of ice cream products, as well as royalty income, franchise fees, and license fees. The operating results of each segment
are regularly reviewed and evaluated separately by the Company’s senior management, which includes, but is not limited to,
the chief executive officer. Senior management primarily evaluates the performance of its segments and allocates resources to
them based on operating income adjusted for amortization of intangible assets, long-lived asset impairment charges, and other
infrequent or unusual charges, which does not reflect the allocation of any corporate charges. This profitability measure is