Baskin Robbins 2015 Annual Report Download - page 54
Download and view the complete annual report
Please find page 54 of the 2015 Baskin Robbins annual report below. You can navigate through the pages in the report by either clicking on the pages listed below, or by using the keyword search tool below to find specific information within the annual report.-
 1
1 -
2
-
3
-
4
-
5
-
6
-
7
-
8
-
9
-
10
-
11
-
12
-
13
-
14
-
15
-
16
-
17
-
18
-
19
-
20
-
21
-
22
-
23
-
24
-
25
-
26
-
27
-
28
-
29
-
30
-
31
-
32
-
33
-
34
-
35
-
36
-
37
-
38
-
39
-
40
-
41
-
42
-
43
-
 44
44 -
 45
45 -
 46
46 -
 47
47 -
 48
48 -
 49
49 -
 50
50 -
 51
51 -
 52
52 -
 53
53 -
 54
54 -
 55
55 -
 56
56 -
 57
57 -
 58
58 -
 59
59 -
 60
60 -
 61
61 -
 62
62 -
 63
63 -
 64
64 -
65
-
66
-
67
-
68
-
69
-
70
-
71
-
72
-
73
-
74
-
75
-
76
-
77
-
78
-
79
-
80
-
81
-
82
-
83
-
84
-
85
-
86
-
87
-
88
-
89
-
90
-
91
-
92
-
93
-
94
-
95
-
96
-
97
-
98
-
99
-
100
-
101
-
102
-
103
-
104
-
105
-
106
-
107
-
108
-
109
-
110
-
111
-
112
 |
 |

-44-
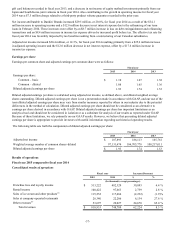
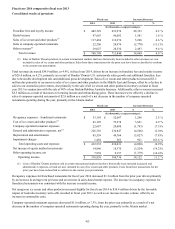
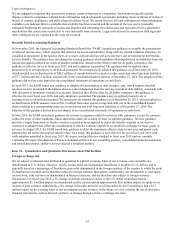
Operating segments
Dunkin’ Donuts U.S.
Fiscal year Increase (Decrease)
2014 2013 $ %
(In thousands, except percentages)
Royalty income $ 387,826 $ 362,342 25,484 7.0 %
Franchise fees 37,388 36,192 1,196 3.3 %
Rental income 93,703 91,918 1,785 1.9 %
Sales at company-operated restaurants 22,206 24,976 (2,770) (11.1)%
Other revenues 7,574 5,751 1,823 31.7 %
Total revenues $ 548,697 521,179 27,518 5.3 %
Segment profit $ 403,591 374,435 29,156 7.8 %
The increase in Dunkin’ Donuts U.S. revenues for fiscal year 2014 was driven primarily by an increase in royalty income of
$25.5 million as a result of an increase in systemwide sales, as well as an increase in other revenues of $1.8 million driven
partially by refranchising gains. Additionally, rental income increased $1.8 million due to an increase in average rent per lease,
as well as the reversal of lease-related liabilities as a result of lease terminations. These increases in revenues were offset by a
decrease in sales at company-operated restaurants of $2.8 million due to a net decrease in the number of company-operated
restaurants operating during fiscal year 2014, primarily in the Atlanta market.
The increase in Dunkin’ Donuts U.S. segment profit for fiscal year 2014 was driven primarily by increases in royalty income
and gains recognized in connection with the sale of the company-operated restaurants in Atlanta and other real estate, as well as
an increase in other revenues. The increases in segment profit were partially offset by increases in personnel costs and
additional bad debt reserves.
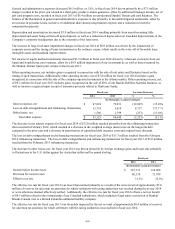
Dunkin’ Donuts International
Fiscal year Increase (Decrease)
2014 2013 $ %
(In thousands, except percentages)
Royalty income $ 15,383 $ 14,249 1,134 8.0 %
Franchise fees 4,430 3,531 899 25.5 %
Rental income 110 133 (23) (17.3)%
Other revenues (56) 403 (459)n/m
Total revenues $ 19,867 18,316 1,551 8.5 %
Segment profit $ 12,103 $ 7,453 4,650 62.4 %
The increase in Dunkin’ Donuts International revenues for fiscal year 2014 resulted primarily from an increase in royalty
income of $1.1 million, driven by an increase in systemwide sales, and in increase in franchise fees of $0.9 million due to
openings in existing and new international markets, offset by income recognized in connection with the termination of
development agreements in Asia in fiscal year 2013. The increases in royalty income and franchise fees were offset by a decline
in other revenues due to a decline in transfer fee income.
The increase in Dunkin’ Donuts International segment profit for fiscal year 2014 was driven primarily by $3.7 million in write-
downs related to our investments in the Dunkin’ Donuts Spain joint venture recorded in fiscal year 2013, as well as revenue
growth. Also contributing to the increase in segment profit was a partial recovery of the previously-reserved notes receivable
from our Spain joint venture, as well as losses incurred from our Spain joint venture in fiscal year 2013. The increases in
segment profit were offset by additional investments in marketing.