Cisco 2014 Annual Report Download - page 43
Download and view the complete annual report
Please find page 43 of the 2014 Cisco annual report below. You can navigate through the pages in the report by either clicking on the pages listed below, or by using the keyword search tool below to find specific information within the annual report.-
 1
1 -
2
-
3
-
4
-
5
-
6
-
7
-
8
-
9
-
10
-
11
-
12
-
13
-
14
-
15
-
16
-
17
-
18
-
19
-
20
-
21
-
22
-
23
-
24
-
25
-
26
-
27
-
28
-
29
-
30
-
31
-
32
-
 33
33 -
 34
34 -
 35
35 -
 36
36 -
 37
37 -
 38
38 -
 39
39 -
 40
40 -
 41
41 -
 42
42 -
 43
43 -
 44
44 -
 45
45 -
 46
46 -
 47
47 -
 48
48 -
 49
49 -
 50
50 -
 51
51 -
 52
52 -
 53
53 -
54
-
55
-
56
-
57
-
58
-
59
-
60
-
61
-
62
-
63
-
64
-
65
-
66
-
67
-
68
-
69
-
70
-
71
-
72
-
73
-
74
-
75
-
76
-
77
-
78
-
79
-
80
-
81
-
82
-
83
-
84
-
85
-
86
-
87
-
88
-
89
-
90
-
91
-
92
-
93
-
94
-
95
-
96
-
97
-
98
-
99
-
100
-
101
-
102
-
103
-
104
-
105
-
106
-
107
-
108
-
109
-
110
-
111
-
112
-
113
-
114
-
115
-
116
-
117
-
118
-
119
-
120
-
121
-
122
-
123
-
124
-
125
-
126
-
127
-
128
-
129
-
130
-
131
-
132
-
133
-
134
-
135
-
136
-
137
-
138
-
139
-
140
 |
 |

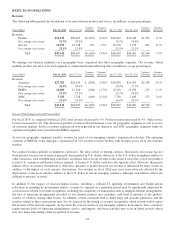
Item 6. Selected Financial Data
Five Years Ended July 26, 2014 (in millions, except per-share amounts)
Years Ended July 26, 2014 (1) July 27, 2013 (2) July 28, 2012 July 30, 2011 (3) July 31, 2010
Revenue .................................... $ 47,142 $ 48,607 $46,061 $43,218 $40,040
Net income .................................. $ 7,853 $ 9,983 $ 8,041 $ 6,490 $ 7,767
Net income per share—basic .................... $ 1.50 $ 1.87 $ 1.50 $ 1.17 $ 1.36
Net income per share—diluted ................... $ 1.49 $ 1.86 $ 1.49 $ 1.17 $ 1.33
Shares used in per-share calculation—basic ........ 5,234 5,329 5,370 5,529 5,732
Shares used in per-share calculation—diluted ....... 5,281 5,380 5,404 5,563 5,848
Cash dividends declared per common share ........ $ 0.72 $ 0.62 $ 0.28 $ 0.12 $ —
Net cash provided by operating activities .......... $ 12,332 $ 12,894 $11,491 $10,079 $10,173
July 26, 2014 July 27, 2013 July 28, 2012 July 30, 2011 July 31, 2010
Cash and cash equivalents and investments ......... $ 52,074 $ 50,610 $48,716 $44,585 $39,861
Total assets .................................. $105,134 $101,191 $91,759 $87,095 $81,130
Debt ....................................... $ 20,909 $ 16,211 $16,328 $16,822 $15,284
Deferred revenue ............................. $ 14,142 $ 13,423 $12,880 $12,207 $11,083
(1) In the second quarter of fiscal 2014, Cisco recorded a pre-tax charge of $655 million to product cost of sales, which
corresponds to $526 million, net of tax, for the expected remediation cost for certain products sold in prior fiscal years
containing memory components manufactured by a single supplier between 2005 and 2010. See Note 12(f) to the
Consolidated Financial Statements.
(2) In the second quarter of fiscal 2013, the Internal Revenue Service (IRS) and Cisco settled all outstanding items related to
its federal income tax returns for fiscal 2002 through fiscal 2007. As a result of the settlement, Cisco recorded a net tax
benefit of $794 million. Also during the second quarter of fiscal 2013, the American Taxpayer Relief Act of 2012
reinstated the U.S. federal R&D tax credit, retroactive to January 1, 2012. As a result of the credit, Cisco recognized tax
benefits of $184 million in fiscal 2013, of which $72 million related to fiscal 2012 R&D expenses.
(3) Net income for the year ended July 30, 2011 included restructuring and other charges of $694 million, net of tax. Cisco
also incurred restructuring charges in fiscal 2012 through fiscal 2014. See Note 5 to the Consolidated Financial
Statements.
No other factors materially affected the comparability of the information presented above.
35