Cisco 2014 Annual Report Download - page 56
Download and view the complete annual report
Please find page 56 of the 2014 Cisco annual report below. You can navigate through the pages in the report by either clicking on the pages listed below, or by using the keyword search tool below to find specific information within the annual report.-
 1
1 -
2
-
3
-
4
-
5
-
6
-
7
-
8
-
9
-
10
-
11
-
12
-
13
-
14
-
15
-
16
-
17
-
18
-
19
-
20
-
21
-
22
-
23
-
24
-
25
-
26
-
27
-
28
-
29
-
30
-
31
-
32
-
33
-
34
-
35
-
36
-
37
-
38
-
39
-
40
-
41
-
42
-
43
-
44
-
45
-
 46
46 -
 47
47 -
 48
48 -
 49
49 -
 50
50 -
 51
51 -
 52
52 -
 53
53 -
 54
54 -
 55
55 -
 56
56 -
 57
57 -
 58
58 -
 59
59 -
 60
60 -
 61
61 -
 62
62 -
 63
63 -
 64
64 -
 65
65 -
 66
66 -
67
-
68
-
69
-
70
-
71
-
72
-
73
-
74
-
75
-
76
-
77
-
78
-
79
-
80
-
81
-
82
-
83
-
84
-
85
-
86
-
87
-
88
-
89
-
90
-
91
-
92
-
93
-
94
-
95
-
96
-
97
-
98
-
99
-
100
-
101
-
102
-
103
-
104
-
105
-
106
-
107
-
108
-
109
-
110
-
111
-
112
-
113
-
114
-
115
-
116
-
117
-
118
-
119
-
120
-
121
-
122
-
123
-
124
-
125
-
126
-
127
-
128
-
129
-
130
-
131
-
132
-
133
-
134
-
135
-
136
-
137
-
138
-
139
-
140
 |
 |

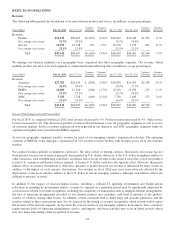
Fiscal 2013 Compared with Fiscal 2012
Product revenue in our Switching category increased by 1%, or $133 million as higher sales of LAN fixed-configuration
switches were partially offset by lower sales of modular switches and storage products. Sales of LAN fixed-configuration
switches increased by 4%, or $347 million, while sales of modular switches decreased by 1%, or approximately $76 million.
The increase in sales of LAN fixed-configuration switches was primarily due to higher sales of Cisco Nexus Series Switches,
partially offset by sales declines in certain of our Cisco Catalyst product families. Sales of modular switches decreased due to
lower sales of Cisco Catalyst 6000 Series Switches, partially offset by higher sales in Cisco Nexus 7000 Series Switches.
Product revenue in the Switching category was also negatively impacted by a 24% decrease in sales of storage products.
NGN Routing
Fiscal 2014 Compared with Fiscal 2013
The decrease in revenue in our NGN Routing product category of 7%, or $581 million, was driven by a 6%, or $278 million,
decrease in revenue from high-end router products; a 9%, or $249 million, decrease in revenue from our midrange and low-end
router products; and an 8%, or $54 million, decrease in revenue from other NGN Routing products. Revenue from our high-end
products decreased due to lower sales of Cisco CRS-3 Carrier Routing System products and our legacy high-end router products,
partially offset by increased sales of our Cisco Aggregation Services Routers (ASR) edge products. The decrease in revenue from
our midrange and low-end router products was driven by lower sales of our Cisco Integrated Services Routers (ISR) products.
Revenue from other NGN Routing products decreased due to lower sales of certain optical networking products.
Fiscal 2013 Compared with Fiscal 2012
Sales in our NGN Routing product category decreased by 2%, or $152 million, driven by a 3%, or $141 million, decrease in sales
of high-end router products and an 8%, or $58 million, decrease in sales of other NGN Routing products. These decreases were
partially offset by a 2%, or $47 million, increase in sales of our midrange and low-end router products. Within the high-end router
product category, we experienced lower sales of our Cisco CRS-1 and CRS-3 Carrier Routing System products and our legacy
high-end router products, partially offset by continued adoption of our Cisco ASR products. Higher sales in our midrange and
low-end router products were driven by the continued adoption of our Cisco ISR platform. The decline in sales of other NGN
Routing products was due to decreased sales of certain other routing and optical networking products.
Service Provider Video
Fiscal 2014 Compared with Fiscal 2013
Revenue in our Service Provider Video product category decreased by 18%, or $886 million, with the largest driver of the
decline being a 21%, or $812 million, decrease in sales of our Service Provider Video infrastructure products. The revenue
decline in Service Provider Video infrastructure products, which includes connected devices products, was due primarily to
lower sales of set-top boxes.
Fiscal 2013 Compared with Fiscal 2012
Our Service Provider Video products category grew by 25%, or $986 million, due primarily to the acquisition of NDS at the
beginning of fiscal 2013. Higher revenue from our Service Provider Video infrastructure products also contributed to the
increase. The increase in sales of our Service Provider Video infrastructure products was primarily due to increased sales of
set-top boxes.
Collaboration
Fiscal 2014 Compared with Fiscal 2013
We continue to increase the proportion of recurring revenue in our Collaboration product category. Overall, revenue in our
Collaboration product category decreased by 6%, or $222 million, primarily due to decreased revenue from our Cisco
TelePresence and Unified Communications products, driven by weakness in endpoint products such as phones. These
decreases were partially offset by higher revenue from our conferencing products.
Fiscal 2013 Compared with Fiscal 2012
Sales of Collaboration products decreased by 6%, or $238 million, primarily due to a decline in sales of Cisco TelePresence
Systems and, to a lesser degree, a decline in sales of Unified Communications products. Lower public sector spending in the
United States, as well as demand weakness in Europe, were significant drivers of the decline in sales of Cisco TelePresence
Systems. We also experienced a decline in sales of Unified Communications products, which was due primarily to lower sales
of Unified Communications infrastructure products as a result of our sales emphasis on shifting towards products with
recurring revenue streams.
48