Cisco 2014 Annual Report Download - page 46
Download and view the complete annual report
Please find page 46 of the 2014 Cisco annual report below. You can navigate through the pages in the report by either clicking on the pages listed below, or by using the keyword search tool below to find specific information within the annual report.-
 1
1 -
2
-
3
-
4
-
5
-
6
-
7
-
8
-
9
-
10
-
11
-
12
-
13
-
14
-
15
-
16
-
17
-
18
-
19
-
20
-
21
-
22
-
23
-
24
-
25
-
26
-
27
-
28
-
29
-
30
-
31
-
32
-
33
-
34
-
35
-
 36
36 -
 37
37 -
 38
38 -
 39
39 -
 40
40 -
 41
41 -
 42
42 -
 43
43 -
 44
44 -
 45
45 -
 46
46 -
 47
47 -
 48
48 -
 49
49 -
 50
50 -
 51
51 -
 52
52 -
 53
53 -
 54
54 -
 55
55 -
 56
56 -
57
-
58
-
59
-
60
-
61
-
62
-
63
-
64
-
65
-
66
-
67
-
68
-
69
-
70
-
71
-
72
-
73
-
74
-
75
-
76
-
77
-
78
-
79
-
80
-
81
-
82
-
83
-
84
-
85
-
86
-
87
-
88
-
89
-
90
-
91
-
92
-
93
-
94
-
95
-
96
-
97
-
98
-
99
-
100
-
101
-
102
-
103
-
104
-
105
-
106
-
107
-
108
-
109
-
110
-
111
-
112
-
113
-
114
-
115
-
116
-
117
-
118
-
119
-
120
-
121
-
122
-
123
-
124
-
125
-
126
-
127
-
128
-
129
-
130
-
131
-
132
-
133
-
134
-
135
-
136
-
137
-
138
-
139
-
140
 |
 |

Fourth Quarter Snapshot
For the fourth quarter of fiscal 2014, as compared with the corresponding period in fiscal 2013, total revenue was flat. Within
the total revenue change, product revenue declined by 2% and service revenue increased by 5%. With regard to our geographic
segment performance, on a year-over-year basis, revenue in the Americas and in EMEA both decreased by 1% while we
experienced a slight increase by 1% in our APJC segment. Total gross margin increased by 0.7 percentage points, primarily
due to the TiVo patent litigation settlement in the fourth quarter of fiscal 2013. As a percentage of revenue, research and
development, sales and marketing, and general and administrative expenses collectively increased by 1.0 percentage points.
Operating income as a percentage of revenue decreased by 1.0 percentage points, primarily as a result of higher restructuring
and other charges, and also the impact of our revenue decrease. Diluted earnings per share increased by 2% from the prior
year, primarily as a result of a decrease in our diluted share count.
Strategy and Focus Areas
Our strategy is to deliver the integrated architectures, solutions, and outcomes to help our customers grow, manage costs, and
mitigate risk. We see our customers, in almost every industry, becoming increasingly reliant on technology—and specifically
the network—to meet their business objectives and compete successfully in the market.
Our focus continues to be on capitalizing on market transitions to maintain leadership in our core markets and to enter new
markets where the network is foundational. We believe this focus best positions us to become a more relevant and trusted
partner to our customers and to expand our share of our customers’ IT spending. We are focused on driving the innovation,
speed, agility, and efficiencies in our company required to deliver leading technology solutions for our customers and
shareholder value for our investors.
Over the last few years, we have been working to transform our business to move from selling individual products and services
to selling products and services integrated into architectures and solutions, as well as to meet customers’ business outcomes.
As a part of this transformation, we are making changes to how we are organized and how we deliver our technology. We
believe these changes enable us to better meet our customers’ requirements and help them stay ahead of market transitions.
For a full discussion of our strategy and focus areas, see Item 1. Business.
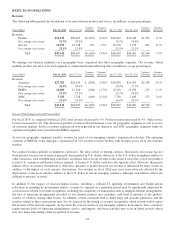
Other Key Financial Measures
The following is a summary of our other key financial measures for fiscal 2014 compared with fiscal 2013 (in millions, except
days sales outstanding in accounts receivable (DSO) and annualized inventory turns):
Fiscal 2014 Fiscal 2013
Cash and cash equivalents and investments ................................................ $52,074 $50,610
Cash provided by operating activities ..................................................... $12,332 $12,894
Deferred revenue ..................................................................... $14,142 $13,423
Repurchases of common stock—stock repurchase program ................................... $ 9,539 $ 2,773
Dividends .......................................................................... $ 3,758 $ 3,310
DSO............................................................................... 38 days 40 days
Inventories ......................................................................... $ 1,591 $ 1,476
Annualized inventory turns ............................................................. 12.7 13.8
Our product backlog at the end of fiscal 2014 was $5.4 billion, or 12% of fiscal 2014 total revenue, compared with $4.9 billion
at the end of fiscal 2013, or 10% of fiscal 2013 total revenue.
38