Dell 2011 Annual Report Download - page 44
Download and view the complete annual report
Please find page 44 of the 2011 Dell annual report below. You can navigate through the pages in the report by either clicking on the pages listed below, or by using the keyword search tool below to find specific information within the annual report.-
 1
1 -
2
-
3
-
4
-
5
-
6
-
7
-
8
-
9
-
10
-
11
-
12
-
13
-
14
-
15
-
16
-
17
-
18
-
19
-
20
-
21
-
22
-
23
-
24
-
25
-
26
-
27
-
28
-
29
-
30
-
31
-
32
-
33
-
 34
34 -
 35
35 -
 36
36 -
 37
37 -
 38
38 -
 39
39 -
 40
40 -
 41
41 -
 42
42 -
 43
43 -
 44
44 -
 45
45 -
 46
46 -
 47
47 -
 48
48 -
 49
49 -
 50
50 -
 51
51 -
 52
52 -
 53
53 -
 54
54 -
55
-
56
-
57
-
58
-
59
-
60
-
61
-
62
-
63
-
64
-
65
-
66
-
67
-
68
-
69
-
70
-
71
-
72
-
73
-
74
-
75
-
76
-
77
-
78
-
79
-
80
-
81
-
82
-
83
-
84
-
85
-
86
-
87
-
88
-
89
-
90
-
91
-
92
-
93
-
94
-
95
-
96
-
97
-
98
-
99
-
100
-
101
-
102
-
103
-
104
-
105
-
106
-
107
-
108
-
109
-
110
-
111
-
112
-
113
-
114
-
115
-
116
-
117
-
118
-
119
-
120
-
121
-
122
-
123
-
124
-
125
-
126
-
127
-
128
-
129
-
130
-
131
-
132
-
133
-
134
-
135
-
136
-
137
 |
 |

Table of Contents
$7.5 billion as of February 3, 2012, and January 28, 2011, respectively. While there are no third-party standards or requirements governing the calculation of
contracted services backlog, our estimated contracted services backlog represents signed contracts that are initially $2 million or more in total expected
revenue with an initial contract term of at least 18 months. The terms of the signed services contracts included in our calculation of services backlog are
subject to change and are affected by terminations, changes in the scope of services, and changes to other factors that could impact the value of the contract.
For these and other reasons, it is not reasonably practicable to estimate the portions for these backlog amounts that will ultimately be recognized as revenue
when performance on the contracts is completed.
We continue to view services as a strategic growth opportunity and will continue to invest in our offerings and resources to focus on increasing our solutions
sales.
•Software and Peripherals — Revenue from sales of software and peripherals (“S&P”) is derived from sales of Dell-branded printers, monitors (not sold
with systems), projectors, keyboards, mice, docking stations, and a multitude of third-party peripherals, including televisions, cameras, stand-alone
software sales and related support services, and other products. During Fiscal 2012, S&P revenue was effectively unchanged when compared to the prior
year. Revenue growth in S&P has been impacted as we continue to reduce our participation in non-strategic areas.
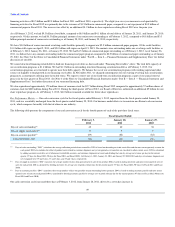
Software revenue from our S&P line of business, which includes stand-alone sales of software license fees and related post-contract customer support, is
reported in services revenue, including software related, on our Consolidated Statements of Income. Software and related support services revenue
represented 32% and 33% of services revenue, including software related, for Fiscal 2012 and Fiscal 2011, respectively.
•Client
▪Mobility — Revenue from mobility products (which include notebooks, mobile workstations, smartphones, and tablets) increased 1% during Fiscal
2012. This increase was primarily attributable to a 3% increase in notebook units sold, largely offset by a 3% decline in average selling price. We
have been experiencing declines in revenue from our lower priced consumer notebooks, which have been largely offset by increases in revenue
from our higher value XPS line of notebooks. During Fiscal 2012, Commercial mobility revenue was essentially unchanged year-over-year, when
compared to Fiscal 2011, while Consumer mobility revenue increased 1%.
▪Desktop PCs — During Fiscal 2012, revenue from desktop PCs (which include desktop computer systems and fixed workstations) decreased 4% as
the average selling price as well as unit sales for our desktop PCs each decreased 2% when compared to Fiscal 2011.
Fiscal 2011 compared to Fiscal 2010
•Enterprise Solutions and Services
▪Enterprise Solutions:
•Servers and Networking — The increase in our servers and networking revenue for Fiscal 2011 as compared to Fiscal 2010 was due to
demand improvements across all Commercial segments. During Fiscal 2011, unit shipments increased 13% year-over-year, and
average selling prices increased 12%, driven by an improved product mix that includes our new product lines.
•Storage — Storage revenue increased 5% for Fiscal 2011. The increase in Storage revenue was primarily driven by our SMB segment
with a 21% increase year-over-year. EqualLogic performance was strong, with year-over-year revenue growth of 62%.
▪Services — Services revenue increased $2.1 billion from $5.6 billion during Fiscal 2010 to $7.7 billion during Fiscal 2011, with revenue from
Perot Systems contributing a large proportion of the increase. As Perot Systems was acquired on November 3, 2009, our services results for
Fiscal 2010 include contributions from Perot Systems for one fiscal quarter. Perot Systems reported revenue of $1.9 billion for the three
quarters ended September 30, 2009.
During Fiscal 2011, we experienced increases in our outsourcing and project-based revenues, due to our acquisition of Perot Systems, while transactional
revenues remained relatively flat. Our estimated services
42