Dell 2011 Annual Report Download - page 49
Download and view the complete annual report
Please find page 49 of the 2011 Dell annual report below. You can navigate through the pages in the report by either clicking on the pages listed below, or by using the keyword search tool below to find specific information within the annual report.-
 1
1 -
2
-
3
-
4
-
5
-
6
-
7
-
8
-
9
-
10
-
11
-
12
-
13
-
14
-
15
-
16
-
17
-
18
-
19
-
20
-
21
-
22
-
23
-
24
-
25
-
26
-
27
-
28
-
29
-
30
-
31
-
32
-
33
-
34
-
35
-
36
-
37
-
38
-
 39
39 -
 40
40 -
 41
41 -
 42
42 -
 43
43 -
 44
44 -
 45
45 -
 46
46 -
 47
47 -
 48
48 -
 49
49 -
 50
50 -
 51
51 -
 52
52 -
 53
53 -
 54
54 -
 55
55 -
 56
56 -
 57
57 -
 58
58 -
 59
59 -
60
-
61
-
62
-
63
-
64
-
65
-
66
-
67
-
68
-
69
-
70
-
71
-
72
-
73
-
74
-
75
-
76
-
77
-
78
-
79
-
80
-
81
-
82
-
83
-
84
-
85
-
86
-
87
-
88
-
89
-
90
-
91
-
92
-
93
-
94
-
95
-
96
-
97
-
98
-
99
-
100
-
101
-
102
-
103
-
104
-
105
-
106
-
107
-
108
-
109
-
110
-
111
-
112
-
113
-
114
-
115
-
116
-
117
-
118
-
119
-
120
-
121
-
122
-
123
-
124
-
125
-
126
-
127
-
128
-
129
-
130
-
131
-
132
-
133
-
134
-
135
-
136
-
137
 |
 |

Table of Contents
LIQUIDITY, CAPITAL COMMITMENTS, AND CONTRACTUAL CASH OBLIGATIONS
Cash and Investments
At February 3, 2012, we had $18.2 billion of total cash, cash equivalents, and investments. The objective of our investment policy and strategy is to manage
our total cash and investments balances to preserve principal and maintain liquidity while maximizing the return on the investment portfolio through the full
investment of available funds. We diversify our investment portfolio by investing in multiple types of investment-grade securities and through the use of
third-party investment managers.
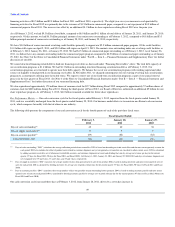
The following table summarizes our ending cash, cash equivalents, and investments balances for the respective periods:
February 3,
2012 January 28,
2011
(in millions)
Cash, cash equivalents, and investments:
Cash and cash equivalents $ 13,852 $ 13,913
Debt securities 4,251 1,032
Equity and other securities 119 124
Cash, cash equivalents, and investments $ 18,222 $ 15,069
Of the $18.2 billion of cash, cash equivalents, and investments, $13.9 billion is classified as cash and cash equivalents. Our cash equivalents primarily consist
of money market funds and commercial paper. Due to the nature of these investments, we consider it reasonable to expect that they will not be significantly
impacted by a change in interest rates, and that these investments can be liquidated for cash at short notice. Our cash equivalents are recorded at fair value.
The remaining $4.3 billion of cash, cash equivalents, and investments is primarily invested in fixed income securities of varying maturities at the date of
acquisition. The fair value of our portfolio can be affected by interest rate movements, credit, and liquidity risks.
Current Market Conditions
We regularly monitor economic conditions and associated impacts on the financial markets and our business. During Fiscal 2012, the global economic
environment continued to experience challenges. We consistently evaluate the financial health of our supplier base, carefully manage customer credit,
diversify counterparty risk, and monitor the concentration risk of our cash and cash equivalents balances globally. We routinely monitor our financial
exposure to both sovereign and non-sovereign borrowers and counterparties, particularly in Europe in recent quarters. At February 3, 2012, our gross
exposures to our customers and investments in Portugal, Ireland, Italy, Greece, and Spain were individually and collectively immaterial.
We monitor credit risk associated with our financial counterparties using various market credit risk indicators such as credit ratings issued by nationally
recognized rating agencies and changes in market credit default swap levels. We perform periodic evaluations of our positions with these counterparties and
may limit exposure to any one counterparty in accordance with our policies. We monitor and manage these activities depending on current and expected
market developments.
See “Part I — Item 1A — Risk Factors” for further discussion of risks associated with our use of counterparties. The impact on our Consolidated Financial
Statements of any credit adjustments related to these counterparties has been immaterial.
Liquidity
Cash generated from operations is our primary source of operating liquidity. In general, we seek to deploy our capital in a systematically prioritized manner
focusing first on requirements for operations, then on growth investments, and finally on returns of cash to stockholders. Our strategy is to deploy capital from
any potential source, whether internally generated cash or debt, depending on the adequacy and availability of that source of capital and whether it can be
accessed in a cost effective manner. We believe that internally generated cash flows, which consist of operating cash flows, are sufficient to support our day-
to-day business operations, both domestically and internationally, for at least the next 12 months. Additionally, while cash generated from operations is our
primary source of operating liquidity, we use a variety of capital sources to fund the growth in our financing receivables, share repurchases and our needs for
less predictable investing and financing decisions such as acquisitions.
Our working capital management team actively monitors the efficiency of our balance sheet under various macroeconomic and competitive scenarios. These
scenarios quantify risks to the financial statements and provide a basis for actions necessary to ensure adequate liquidity, both domestically and
internationally, to support our acquisition and investment strategy, share repurchase activity and other corporate needs. We utilize external capital sources,
such as long-term notes and structured
47