HSBC 2010 Annual Report Download - page 29
Download and view the complete annual report
Please find page 29 of the 2010 HSBC annual report below. You can navigate through the pages in the report by either clicking on the pages listed below, or by using the keyword search tool below to find specific information within the annual report.-
 1
1 -
2
-
3
-
4
-
5
-
6
-
7
-
8
-
9
-
10
-
11
-
12
-
13
-
14
-
15
-
16
-
17
-
18
-
 19
19 -
 20
20 -
 21
21 -
 22
22 -
 23
23 -
 24
24 -
 25
25 -
 26
26 -
 27
27 -
 28
28 -
 29
29 -
 30
30 -
 31
31 -
 32
32 -
 33
33 -
 34
34 -
 35
35 -
 36
36 -
 37
37 -
 38
38 -
 39
39 -
40
-
41
-
42
-
43
-
44
-
45
-
46
-
47
-
48
-
49
-
50
-
51
-
52
-
53
-
54
-
55
-
56
-
57
-
58
-
59
-
60
-
61
-
62
-
63
-
64
-
65
-
66
-
67
-
68
-
69
-
70
-
71
-
72
-
73
-
74
-
75
-
76
-
77
-
78
-
79
-
80
-
81
-
82
-
83
-
84
-
85
-
86
-
87
-
88
-
89
-
90
-
91
-
92
-
93
-
94
-
95
-
96
-
97
-
98
-
99
-
100
-
101
-
102
-
103
-
104
-
105
-
106
-
107
-
108
-
109
-
110
-
111
-
112
-
113
-
114
-
115
-
116
-
117
-
118
-
119
-
120
-
121
-
122
-
123
-
124
-
125
-
126
-
127
-
128
-
129
-
130
-
131
-
132
-
133
-
134
-
135
-
136
-
137
-
138
-
139
-
140
-
141
-
142
-
143
-
144
-
145
-
146
-
147
-
148
-
149
-
150
-
151
-
152
-
153
-
154
-
155
-
156
-
157
-
158
-
159
-
160
-
161
-
162
-
163
-
164
-
165
-
166
-
167
-
168
-
169
-
170
-
171
-
172
-
173
-
174
-
175
-
176
-
177
-
178
-
179
-
180
-
181
-
182
-
183
-
184
-
185
-
186
-
187
-
188
-
189
-
190
-
191
-
192
-
193
-
194
-
195
-
196
-
197
-
198
-
199
-
200
-
201
-
202
-
203
-
204
-
205
-
206
-
207
-
208
-
209
-
210
-
211
-
212
-
213
-
214
-
215
-
216
-
217
-
218
-
219
-
220
-
221
-
222
-
223
-
224
-
225
-
226
-
227
-
228
-
229
-
230
-
231
-
232
-
233
-
234
-
235
-
236
-
237
-
238
-
239
-
240
-
241
-
242
-
243
-
244
-
245
-
246
-
247
-
248
-
249
-
250
-
251
-
252
-
253
-
254
-
255
-
256
-
257
-
258
-
259
-
260
-
261
-
262
-
263
-
264
-
265
-
266
-
267
-
268
-
269
-
270
-
271
-
272
-
273
-
274
-
275
-
276
-
277
-
278
-
279
-
280
-
281
-
282
-
283
-
284
-
285
-
286
-
287
-
288
-
289
-
290
-
291
-
292
-
293
-
294
-
295
-
296
-
297
-
298
-
299
-
300
-
301
-
302
-
303
-
304
-
305
-
306
-
307
-
308
-
309
-
310
-
311
-
312
-
313
-
314
-
315
-
316
-
317
-
318
-
319
-
320
-
321
-
322
-
323
-
324
-
325
-
326
-
327
-
328
-
329
-
330
-
331
-
332
-
333
-
334
-
335
-
336
-
337
-
338
-
339
-
340
-
341
-
342
-
343
-
344
-
345
-
346
-
347
-
348
-
349
-
350
-
351
-
352
-
353
-
354
-
355
-
356
-
357
-
358
-
359
-
360
-
361
-
362
-
363
-
364
-
365
-
366
-
367
-
368
-
369
-
370
-
371
-
372
-
373
-
374
-
375
-
376
-
377
-
378
-
379
-
380
-
381
-
382
-
383
-
384
-
385
-
386
-
387
-
388
-
389
-
390
-
391
-
392
-
393
-
394
-
395
-
396
 |
 |

27
Overview Operating & Financial Review Governance Financial Statements Shareholder Information
Excluding these items, staff costs rose by 3%.
Performance-related costs increased, primarily in
Asia, reflecting improved business performance and
increased staff numbers. While year-end staff
numbers increased as the pace of recruitment
accelerated in the second half of the year, average
staff numbers remained below 2009 levels. The
growth in staff numbers in Asia encompassed both
customer-facing and back-office staff supporting
business growth and increased operational capacity.
In Latin America, staff costs grew following union-
agreed salary increases and the recruitment of
customer-facing and regional support staff, primarily
in the latter part of the year. We also increased
resources in our Global Service Centres as we
continued to move processes there.
Staff costs declined in the US due to the non-
recurrence of restructuring costs associated with the
closure of the Consumer Lending branch network in
2009. Also, headcount fell due to the sale of the
vehicle finance portfolio and related servicing
platform. Similarly, reported staff numbers fell in
Europe due to the sale of the insurance broking
business in the UK and business reorganisation in
France, though this was partly offset by higher
numbers of customer-facing staff in the UK and
Turkey.
Premises and equipment costs increased as
rental costs in the UK, the US and France rose
following the sale and leaseback of 8 Canada
Square, London and our headquarters buildings
in the US and France, combined with business
expansion in Asia and Europe and refurbishment
costs in Europe and Latin America. This was partly
offset by lower costs in the US following the closure
of the Consumer Lending branch offices and the
non-recurrence of the related restructuring costs.
General and administrative expenses rose,
reflecting in part higher marketing and advertising
costs. These grew in North America in Card and
Retail Services, partly from complying with the
CARD Act. Marketing costs also rose in Asia and
Latin America in support of the launch of Advance
and sales campaigns for credit cards and investment
products. Project costs increased from various
initiatives to enhance operational capabilities, in
connection with which consultancy and contractors’
fees rose, primarily in the UK as GB&M continued
to invest in strategic initiatives to drive future
revenue growth. These included the development of
Prime Services and equity market capabilities, and
the expansion of the Rates and foreign exchange
e-commerce platforms.
Travel costs increased as we increased our focus
on international connectivity and business growth.
Costs also increased due to litigation provisions in
North America and Europe.
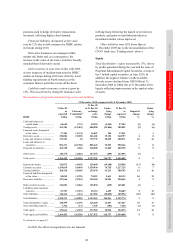
Cost efficiency ratios
2010
%
2009
%
2008
%
HSBC ......................................................................................................................... 55.2 52.0 60.1
Personal Financial Services ..................................................................................... 57.7 51.7 76.4
Europe ........................................................................................................................ 67.4 68.7 62.7
Hong Kong ................................................................................................................. 35.3 34.9 32.2
Rest of Asia-Pacific .................................................................................................... 85.1 81.2 81.5
Middle East ................................................................................................................. 62.2 53.5 53.2
North America ............................................................................................................ 46.9 38.1 106.8
Latin America ............................................................................................................. 72.1 66.7 59.7
Commercial Banking ............................................................................................... 49.4 46.4 43.0
Europe ........................................................................................................................ 51.9 47.4 44.2
Hong Kong ................................................................................................................. 32.2 33.7 26.2
Rest of Asia-Pacific .................................................................................................... 49.2 47.0 45.9
Middle East ................................................................................................................. 36.4 33.8 32.0
North America ............................................................................................................ 46.6 47.7 46.1
Latin America ............................................................................................................. 65.7 57.0 55.0
Global Banking and Markets .................................................................................. 49.9 39.1 67.3
Global Private Banking ........................................................................................... 65.8 60.5 58.3
Our cost efficiency ratio worsened by 3.2
percentage points on a reported basis and by 8.4
percentage points to 55.8% on an underlying basis.
In PFS, there was a deterioration of 5.7 percentage
points in the cost efficiency ratio. Operating expenses
remained broadly unchanged as a rise in costs in