HSBC 2010 Annual Report Download - page 314
Download and view the complete annual report
Please find page 314 of the 2010 HSBC annual report below. You can navigate through the pages in the report by either clicking on the pages listed below, or by using the keyword search tool below to find specific information within the annual report.-
 1
1 -
2
-
3
-
4
-
5
-
6
-
7
-
8
-
9
-
10
-
11
-
12
-
13
-
14
-
15
-
16
-
17
-
18
-
19
-
20
-
21
-
22
-
23
-
24
-
25
-
26
-
27
-
28
-
29
-
30
-
31
-
32
-
33
-
34
-
35
-
36
-
37
-
38
-
39
-
40
-
41
-
42
-
43
-
44
-
45
-
46
-
47
-
48
-
49
-
50
-
51
-
52
-
53
-
54
-
55
-
56
-
57
-
58
-
59
-
60
-
61
-
62
-
63
-
64
-
65
-
66
-
67
-
68
-
69
-
70
-
71
-
72
-
73
-
74
-
75
-
76
-
77
-
78
-
79
-
80
-
81
-
82
-
83
-
84
-
85
-
86
-
87
-
88
-
89
-
90
-
91
-
92
-
93
-
94
-
95
-
96
-
97
-
98
-
99
-
100
-
101
-
102
-
103
-
104
-
105
-
106
-
107
-
108
-
109
-
110
-
111
-
112
-
113
-
114
-
115
-
116
-
117
-
118
-
119
-
120
-
121
-
122
-
123
-
124
-
125
-
126
-
127
-
128
-
129
-
130
-
131
-
132
-
133
-
134
-
135
-
136
-
137
-
138
-
139
-
140
-
141
-
142
-
143
-
144
-
145
-
146
-
147
-
148
-
149
-
150
-
151
-
152
-
153
-
154
-
155
-
156
-
157
-
158
-
159
-
160
-
161
-
162
-
163
-
164
-
165
-
166
-
167
-
168
-
169
-
170
-
171
-
172
-
173
-
174
-
175
-
176
-
177
-
178
-
179
-
180
-
181
-
182
-
183
-
184
-
185
-
186
-
187
-
188
-
189
-
190
-
191
-
192
-
193
-
194
-
195
-
196
-
197
-
198
-
199
-
200
-
201
-
202
-
203
-
204
-
205
-
206
-
207
-
208
-
209
-
210
-
211
-
212
-
213
-
214
-
215
-
216
-
217
-
218
-
219
-
220
-
221
-
222
-
223
-
224
-
225
-
226
-
227
-
228
-
229
-
230
-
231
-
232
-
233
-
234
-
235
-
236
-
237
-
238
-
239
-
240
-
241
-
242
-
243
-
244
-
245
-
246
-
247
-
248
-
249
-
250
-
251
-
252
-
253
-
254
-
255
-
256
-
257
-
258
-
259
-
260
-
261
-
262
-
263
-
264
-
265
-
266
-
267
-
268
-
269
-
270
-
271
-
272
-
273
-
274
-
275
-
276
-
277
-
278
-
279
-
280
-
281
-
282
-
283
-
284
-
285
-
286
-
287
-
288
-
289
-
290
-
291
-
292
-
293
-
294
-
295
-
296
-
297
-
298
-
299
-
300
-
301
-
302
-
303
-
 304
304 -
 305
305 -
 306
306 -
 307
307 -
 308
308 -
 309
309 -
 310
310 -
 311
311 -
 312
312 -
 313
313 -
 314
314 -
 315
315 -
 316
316 -
 317
317 -
 318
318 -
 319
319 -
 320
320 -
 321
321 -
 322
322 -
 323
323 -
 324
324 -
325
-
326
-
327
-
328
-
329
-
330
-
331
-
332
-
333
-
334
-
335
-
336
-
337
-
338
-
339
-
340
-
341
-
342
-
343
-
344
-
345
-
346
-
347
-
348
-
349
-
350
-
351
-
352
-
353
-
354
-
355
-
356
-
357
-
358
-
359
-
360
-
361
-
362
-
363
-
364
-
365
-
366
-
367
-
368
-
369
-
370
-
371
-
372
-
373
-
374
-
375
-
376
-
377
-
378
-
379
-
380
-
381
-
382
-
383
-
384
-
385
-
386
-
387
-
388
-
389
-
390
-
391
-
392
-
393
-
394
-
395
-
396
 |
 |

HSBC HOLDINGS PLC
Notes on the Financial Statements (continued)
16 – Fair values of financial instruments carried at fair value
312
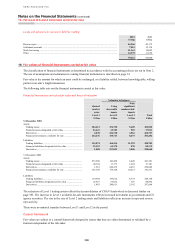
Credit risk adjustment methodology
HSBC calculates a separate credit risk adjustment for each HSBC legal entity, and within each entity for each
counterparty to which the entity has exposure. The calculation of the monoline credit risk adjustment and sensitivity
to different assumptions is described on page 137. Of the total credit risk adjustment at 31 December 2010 of
US$1,355m (2009: US$2,172m), US$836m (2009: US$1,163m) relates to the credit risk adjustment taken against
non-monoline counterparties. The methodology for calculating the credit risk adjustment for non-monoline
counterparties is described below.
HSBC calculates the credit risk adjustment by applying the probability of default of the counterparty to the
expected positive exposure to the counterparty, and multiplying the result by the loss expected in the event of default.
The calculation is performed over the life of the potential exposure.
The probability of default is based on HSBC’s internal credit rating for the counterparty, taking into account
how credit ratings may deteriorate over the duration of the exposure through the use of historical rating transition
matrices. For most products, to calculate the expected positive exposure to a counterparty, HSBC uses a simulation
methodology to incorporate the range of potential exposures across the portfolio of transactions with the counterparty
over the life of an instrument. The simulation methodology includes credit mitigants such as counterparty netting
agreements and collateral agreements with the counterparty. A standard loss given default assumption of 60% is
generally adopted. HSBC does not adjust derivative liabilities for HSBC’s own credit risk, such an adjustment is
often referred to as a ‘debit valuation adjustment’.
For certain types of exotic derivatives where the products are not currently supported by the simulation, or
for derivative exposures in smaller trading locations where the simulation tool is not yet available, HSBC adopts
alternative methodologies. These may involve mapping to the results for similar products from the simulation tool
or where such a mapping approach is not appropriate, a simplified methodology is used, generally following the same
principles as the simulation methodology. The calculation is applied at a trade level, with more limited recognition of
credit mitigants such as netting or collateral agreements than used in the simulation methodology described
previously.
The methodologies do not, in general, account for ‘wrong-way risk’. Wrong-way risk arises where the
underlying value of the derivative prior to any credit risk adjustment is positively correlated to the probability
of default of the counterparty. Where there is significant wrong-way risk, a trade specific approach is applied to
reflect the wrong-way risk within the valuation.
HSBC includes all third party counterparties in the credit risk adjustment calculation and does not net credit risk
adjustments across HSBC Group entities. During 2010, there were no material changes made by HSBC to the
methodologies used to calculate the credit risk adjustment.
Fair value valuation bases
Financial instruments measured at fair value using a valuation technique with significant unobservable inputs –
Level 3
Assets Liabilities
Available
for sale
Held for
trading
Designated
at fair value
through
profit or loss Derivatives
Held for
trading
Designated
at fair value
through
profit or loss
Derivatives
US$m US$m US$m US$m US$m US$m US$m
At 31 December 2010
Private equity including strategic
investments ................................... 4,057 278 120 – – – –
Asset-backed securities .................... 1,949 566 – – – – –
Leveraged finance ............................. – – – – – – 11
Loans held for securitisation ............ – 1,043 – – – – –
Structured notes ................................ – – – – 10,667 – –
Derivatives with monolines .............. – – – 1,005 – – –
Other derivatives ............................... – – – 2,956 – – 3,787
Other portfolios ................................. 2,231 3,802 467 – 726 570 8
8,237 5,689 587 3,961 11,393 570 3,806