HSBC 2010 Annual Report Download - page 320
Download and view the complete annual report
Please find page 320 of the 2010 HSBC annual report below. You can navigate through the pages in the report by either clicking on the pages listed below, or by using the keyword search tool below to find specific information within the annual report.-
 1
1 -
2
-
3
-
4
-
5
-
6
-
7
-
8
-
9
-
10
-
11
-
12
-
13
-
14
-
15
-
16
-
17
-
18
-
19
-
20
-
21
-
22
-
23
-
24
-
25
-
26
-
27
-
28
-
29
-
30
-
31
-
32
-
33
-
34
-
35
-
36
-
37
-
38
-
39
-
40
-
41
-
42
-
43
-
44
-
45
-
46
-
47
-
48
-
49
-
50
-
51
-
52
-
53
-
54
-
55
-
56
-
57
-
58
-
59
-
60
-
61
-
62
-
63
-
64
-
65
-
66
-
67
-
68
-
69
-
70
-
71
-
72
-
73
-
74
-
75
-
76
-
77
-
78
-
79
-
80
-
81
-
82
-
83
-
84
-
85
-
86
-
87
-
88
-
89
-
90
-
91
-
92
-
93
-
94
-
95
-
96
-
97
-
98
-
99
-
100
-
101
-
102
-
103
-
104
-
105
-
106
-
107
-
108
-
109
-
110
-
111
-
112
-
113
-
114
-
115
-
116
-
117
-
118
-
119
-
120
-
121
-
122
-
123
-
124
-
125
-
126
-
127
-
128
-
129
-
130
-
131
-
132
-
133
-
134
-
135
-
136
-
137
-
138
-
139
-
140
-
141
-
142
-
143
-
144
-
145
-
146
-
147
-
148
-
149
-
150
-
151
-
152
-
153
-
154
-
155
-
156
-
157
-
158
-
159
-
160
-
161
-
162
-
163
-
164
-
165
-
166
-
167
-
168
-
169
-
170
-
171
-
172
-
173
-
174
-
175
-
176
-
177
-
178
-
179
-
180
-
181
-
182
-
183
-
184
-
185
-
186
-
187
-
188
-
189
-
190
-
191
-
192
-
193
-
194
-
195
-
196
-
197
-
198
-
199
-
200
-
201
-
202
-
203
-
204
-
205
-
206
-
207
-
208
-
209
-
210
-
211
-
212
-
213
-
214
-
215
-
216
-
217
-
218
-
219
-
220
-
221
-
222
-
223
-
224
-
225
-
226
-
227
-
228
-
229
-
230
-
231
-
232
-
233
-
234
-
235
-
236
-
237
-
238
-
239
-
240
-
241
-
242
-
243
-
244
-
245
-
246
-
247
-
248
-
249
-
250
-
251
-
252
-
253
-
254
-
255
-
256
-
257
-
258
-
259
-
260
-
261
-
262
-
263
-
264
-
265
-
266
-
267
-
268
-
269
-
270
-
271
-
272
-
273
-
274
-
275
-
276
-
277
-
278
-
279
-
280
-
281
-
282
-
283
-
284
-
285
-
286
-
287
-
288
-
289
-
290
-
291
-
292
-
293
-
294
-
295
-
296
-
297
-
298
-
299
-
300
-
301
-
302
-
303
-
304
-
305
-
306
-
307
-
308
-
309
-
 310
310 -
 311
311 -
 312
312 -
 313
313 -
 314
314 -
 315
315 -
 316
316 -
 317
317 -
 318
318 -
 319
319 -
 320
320 -
 321
321 -
 322
322 -
 323
323 -
 324
324 -
 325
325 -
 326
326 -
 327
327 -
 328
328 -
 329
329 -
 330
330 -
331
-
332
-
333
-
334
-
335
-
336
-
337
-
338
-
339
-
340
-
341
-
342
-
343
-
344
-
345
-
346
-
347
-
348
-
349
-
350
-
351
-
352
-
353
-
354
-
355
-
356
-
357
-
358
-
359
-
360
-
361
-
362
-
363
-
364
-
365
-
366
-
367
-
368
-
369
-
370
-
371
-
372
-
373
-
374
-
375
-
376
-
377
-
378
-
379
-
380
-
381
-
382
-
383
-
384
-
385
-
386
-
387
-
388
-
389
-
390
-
391
-
392
-
393
-
394
-
395
-
396
 |
 |

HSBC HOLDINGS PLC
Notes on the Financial Statements (continued)
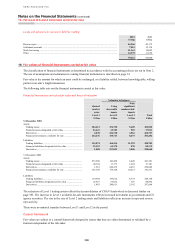
17 – Fair values of financial instruments not carried at fair value
318
17 Fair values of financial instruments not carried at fair value
The classification of financial instruments is determined in accordance with the accounting policies set out in Note 2.
Fair values of financial instruments which are not carried at fair value on the balance sheet
At 31 December 2010 At 31 December 2009
Carrying
amount
Fair
value
Carrying
amount
Fair
value
US$m US$m US$m US$m
Assets
Loans and advances to banks ................................................................... 208,271 208,311 179,781 179,658
Loans and advances to customers ............................................................ 958,366 934,444 896,231 855,780
Financial investments: debt securities ...................................................... 19,386 20,374 17,526 18,097
Financial investments: treasury and other eligible bills ........................... 113 113 101 101
Liabilities
Deposits by banks ..................................................................................... 110,584 110,563 124,872 124,856
Customer accounts .................................................................................... 1,227,725 1,227,428 1,159,034 1,160,036
Debt securities in issue ............................................................................. 145,401 145,417 146,896 145,888
Subordinated liabilities ............................................................................. 33,387 33,161 30,478 30,307
Fair values of financial instruments held for sale which are not carried at fair value on the balance sheet
At 31 December 2010 At 31 December 2009
Carrying
amount
Fair
value
Carrying
amount
Fair
value
US$m US$m US$m US$m
Assets classified as held for sale
Loans and advances to banks and customers ........................................... 116 116 1,356 1,316
The following is a list of financial instruments whose carrying amount is a reasonable approximation of fair value
because, for example, they are short-term in nature or reprice to current market rates frequently:
Assets
Cash and balances at central banks
Items in the course of collection from other banks
Hong Kong Government certificates of indebtedness
Endorsements and acceptances
Short-term receivables within ‘Other assets’
Accrued income
Liabilities
Hong Kong currency notes in circulation
Items in the course of transmission to other banks
Investment contracts with discretionary participation features within ‘Liabilities under insurance contracts’
Endorsements and acceptances
Short-term payables within ‘Other liabilities’
Accruals
Analysis of loans and advances to customers by geographical segment
At 31 December 2010 At 31 December 2009
Carrying
amount
Fair
value
Carrying
amount
Fair
value
US$m US$m US$m US$m
Loans and advances to customers
Europe ....................................................................................................... 435,799 430,333 439,481 431,158
Hong Kong ............................................................................................... 140,691 140,699 99,381 99,694
Rest of Asia-Pacific .................................................................................. 108,731 108,582 80,043 79,972
Middle East ............................................................................................... 24,626 24,539 22,844 22,538
North America .......................................................................................... 190,532 172,522 206,853 174,957
Latin America ........................................................................................... 57,987 57,769 47,629 47,461
958,366 934,444 896,231 855,780