HSBC 2011 Annual Report Download - page 355
Download and view the complete annual report
Please find page 355 of the 2011 HSBC annual report below. You can navigate through the pages in the report by either clicking on the pages listed below, or by using the keyword search tool below to find specific information within the annual report.-
 1
1 -
2
-
3
-
4
-
5
-
6
-
7
-
8
-
9
-
10
-
11
-
12
-
13
-
14
-
15
-
16
-
17
-
18
-
19
-
20
-
21
-
22
-
23
-
24
-
25
-
26
-
27
-
28
-
29
-
30
-
31
-
32
-
33
-
34
-
35
-
36
-
37
-
38
-
39
-
40
-
41
-
42
-
43
-
44
-
45
-
46
-
47
-
48
-
49
-
50
-
51
-
52
-
53
-
54
-
55
-
56
-
57
-
58
-
59
-
60
-
61
-
62
-
63
-
64
-
65
-
66
-
67
-
68
-
69
-
70
-
71
-
72
-
73
-
74
-
75
-
76
-
77
-
78
-
79
-
80
-
81
-
82
-
83
-
84
-
85
-
86
-
87
-
88
-
89
-
90
-
91
-
92
-
93
-
94
-
95
-
96
-
97
-
98
-
99
-
100
-
101
-
102
-
103
-
104
-
105
-
106
-
107
-
108
-
109
-
110
-
111
-
112
-
113
-
114
-
115
-
116
-
117
-
118
-
119
-
120
-
121
-
122
-
123
-
124
-
125
-
126
-
127
-
128
-
129
-
130
-
131
-
132
-
133
-
134
-
135
-
136
-
137
-
138
-
139
-
140
-
141
-
142
-
143
-
144
-
145
-
146
-
147
-
148
-
149
-
150
-
151
-
152
-
153
-
154
-
155
-
156
-
157
-
158
-
159
-
160
-
161
-
162
-
163
-
164
-
165
-
166
-
167
-
168
-
169
-
170
-
171
-
172
-
173
-
174
-
175
-
176
-
177
-
178
-
179
-
180
-
181
-
182
-
183
-
184
-
185
-
186
-
187
-
188
-
189
-
190
-
191
-
192
-
193
-
194
-
195
-
196
-
197
-
198
-
199
-
200
-
201
-
202
-
203
-
204
-
205
-
206
-
207
-
208
-
209
-
210
-
211
-
212
-
213
-
214
-
215
-
216
-
217
-
218
-
219
-
220
-
221
-
222
-
223
-
224
-
225
-
226
-
227
-
228
-
229
-
230
-
231
-
232
-
233
-
234
-
235
-
236
-
237
-
238
-
239
-
240
-
241
-
242
-
243
-
244
-
245
-
246
-
247
-
248
-
249
-
250
-
251
-
252
-
253
-
254
-
255
-
256
-
257
-
258
-
259
-
260
-
261
-
262
-
263
-
264
-
265
-
266
-
267
-
268
-
269
-
270
-
271
-
272
-
273
-
274
-
275
-
276
-
277
-
278
-
279
-
280
-
281
-
282
-
283
-
284
-
285
-
286
-
287
-
288
-
289
-
290
-
291
-
292
-
293
-
294
-
295
-
296
-
297
-
298
-
299
-
300
-
301
-
302
-
303
-
304
-
305
-
306
-
307
-
308
-
309
-
310
-
311
-
312
-
313
-
314
-
315
-
316
-
317
-
318
-
319
-
320
-
321
-
322
-
323
-
324
-
325
-
326
-
327
-
328
-
329
-
330
-
331
-
332
-
333
-
334
-
335
-
336
-
337
-
338
-
339
-
340
-
341
-
342
-
343
-
344
-
 345
345 -
 346
346 -
 347
347 -
 348
348 -
 349
349 -
 350
350 -
 351
351 -
 352
352 -
 353
353 -
 354
354 -
 355
355 -
 356
356 -
 357
357 -
 358
358 -
 359
359 -
 360
360 -
 361
361 -
 362
362 -
 363
363 -
 364
364 -
 365
365 -
366
-
367
-
368
-
369
-
370
-
371
-
372
-
373
-
374
-
375
-
376
-
377
-
378
-
379
-
380
-
381
-
382
-
383
-
384
-
385
-
386
-
387
-
388
-
389
-
390
-
391
-
392
-
393
-
394
-
395
-
396
-
397
-
398
-
399
-
400
-
401
-
402
-
403
-
404
-
405
-
406
-
407
-
408
-
409
-
410
-
411
-
412
-
413
-
414
-
415
-
416
-
417
-
418
-
419
-
420
-
421
-
422
-
423
-
424
-
425
-
426
-
427
-
428
-
429
-
430
-
431
-
432
-
433
-
434
-
435
-
436
-
437
-
438
-
439
-
440
 |
 |

353
Overview Operating & Financial Review Corporate Governance Financial Statements Shareholder Information
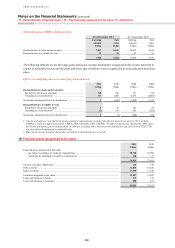
Reconciliation of fair value measurements in Level 3 of the fair value hierarchy
The following table provides a reconciliation of the movement between opening and closing balances of Level 3
financial instruments, measured at fair value using a valuation technique with significant unobservable inputs:
Movement in Level 3 financial instruments
Assets Liabilities
Available
for sale
Held for
trading
Designated
at fair value
through
profit or loss Derivatives
Held for
trading
Designated
at fair value
through
profit or loss
Derivatives
US$m US$m US$m US$m US$m US$m US$m
2011
At 1 January ...................................... 8,237 5,689 587 3,961 11,393 570 3,806
Total gains/losses recognised in
profit or loss ................................. 222 (330) 11 767 36 8 628
Total gains/losses recognised in
other comprehensive income1 ...... (179) (12) (15) (16) 11 (11) –
Purchases .......................................... 1,858 1,483 242 – (1,843) – –
New issuances ................................... – – – – 4,569 – –
Sales .................................................. (756) (2,578) (69) – – – –
Settlements ........................................ (1,088) (199) (7) (33) (1,528) – (1,083)
Transfers out ..................................... (1,891) (569) (173) (410) (5,266) – (608)
Transfers in ....................................... 2,718 1,296 140 180 455 – 386
At 31 December ................................ 9,121 4,780 716 4,449 7,827 567 3,129
Total gains/losses recognised in profit
or loss relating to assets and
liabilities held on 31 December: 134 (237) 36 617 101 8 80
– net interest income ................... 105 – – – – – –
– trading income excluding net
interest income ......................... – (265) –617 119 – 80
– net interest income on trading
activities ................................... – 28 – – (18) – –
– net income/expense from
other financial instruments
designated at fair value ............ – –36 –– 8 –
– dividend income ....................... 29 – – – – – –
2010
At 1 January ...................................... 10,214 6,420 1,224 4,453 8,774 507 5,192
Total gains/losses recognised in
profit or loss ................................. 345 158 63 (675) 166 (11) (240)
Total gains/losses recognised in
other comprehensive income1 ...... 618 (101) (36) (110) (157) 74 93
Purchases .......................................... 3,708 858 81 – (356) – –
New issuances ................................... – – – – 4,025 – –
Sales .................................................. (2,461) (1,543) (8) – – – –
Settlements ........................................ (1,032) 1 (22) 64 (948) – (820)
Transfers out ..................................... (7,065) (629) (894) (669) (1,750) – (1,003)
Transfers in ....................................... 3,910 525 179 898 1,639 – 584
At 31 December ................................ 8,237 5,689 587 3,961 11,393 570 3,806
Total gains/losses recognised in profit
or loss relating to assets and
liabilities held on 31 December: 113 116 17 268 180 (14) 361
– net interest income ................... 89 – – – – – –
– trading income excluding net
interest income ......................... – 98 – 268 198 – 361
– net interest income on trading
activities ................................... – 18 – – (18) – –
– net income/expense from
other financial instruments
designated at fair value ............ – – 17 – – (14) –
– dividend income ....................... 24 – – – – – –
1 Included in ‘Available-for-sale investments: Fair value gains/losses’ and ‘Exchange differences’ in the consolidated statement of
comprehensive income.