HSBC 2011 Annual Report Download - page 370
Download and view the complete annual report
Please find page 370 of the 2011 HSBC annual report below. You can navigate through the pages in the report by either clicking on the pages listed below, or by using the keyword search tool below to find specific information within the annual report.-
 1
1 -
2
-
3
-
4
-
5
-
6
-
7
-
8
-
9
-
10
-
11
-
12
-
13
-
14
-
15
-
16
-
17
-
18
-
19
-
20
-
21
-
22
-
23
-
24
-
25
-
26
-
27
-
28
-
29
-
30
-
31
-
32
-
33
-
34
-
35
-
36
-
37
-
38
-
39
-
40
-
41
-
42
-
43
-
44
-
45
-
46
-
47
-
48
-
49
-
50
-
51
-
52
-
53
-
54
-
55
-
56
-
57
-
58
-
59
-
60
-
61
-
62
-
63
-
64
-
65
-
66
-
67
-
68
-
69
-
70
-
71
-
72
-
73
-
74
-
75
-
76
-
77
-
78
-
79
-
80
-
81
-
82
-
83
-
84
-
85
-
86
-
87
-
88
-
89
-
90
-
91
-
92
-
93
-
94
-
95
-
96
-
97
-
98
-
99
-
100
-
101
-
102
-
103
-
104
-
105
-
106
-
107
-
108
-
109
-
110
-
111
-
112
-
113
-
114
-
115
-
116
-
117
-
118
-
119
-
120
-
121
-
122
-
123
-
124
-
125
-
126
-
127
-
128
-
129
-
130
-
131
-
132
-
133
-
134
-
135
-
136
-
137
-
138
-
139
-
140
-
141
-
142
-
143
-
144
-
145
-
146
-
147
-
148
-
149
-
150
-
151
-
152
-
153
-
154
-
155
-
156
-
157
-
158
-
159
-
160
-
161
-
162
-
163
-
164
-
165
-
166
-
167
-
168
-
169
-
170
-
171
-
172
-
173
-
174
-
175
-
176
-
177
-
178
-
179
-
180
-
181
-
182
-
183
-
184
-
185
-
186
-
187
-
188
-
189
-
190
-
191
-
192
-
193
-
194
-
195
-
196
-
197
-
198
-
199
-
200
-
201
-
202
-
203
-
204
-
205
-
206
-
207
-
208
-
209
-
210
-
211
-
212
-
213
-
214
-
215
-
216
-
217
-
218
-
219
-
220
-
221
-
222
-
223
-
224
-
225
-
226
-
227
-
228
-
229
-
230
-
231
-
232
-
233
-
234
-
235
-
236
-
237
-
238
-
239
-
240
-
241
-
242
-
243
-
244
-
245
-
246
-
247
-
248
-
249
-
250
-
251
-
252
-
253
-
254
-
255
-
256
-
257
-
258
-
259
-
260
-
261
-
262
-
263
-
264
-
265
-
266
-
267
-
268
-
269
-
270
-
271
-
272
-
273
-
274
-
275
-
276
-
277
-
278
-
279
-
280
-
281
-
282
-
283
-
284
-
285
-
286
-
287
-
288
-
289
-
290
-
291
-
292
-
293
-
294
-
295
-
296
-
297
-
298
-
299
-
300
-
301
-
302
-
303
-
304
-
305
-
306
-
307
-
308
-
309
-
310
-
311
-
312
-
313
-
314
-
315
-
316
-
317
-
318
-
319
-
320
-
321
-
322
-
323
-
324
-
325
-
326
-
327
-
328
-
329
-
330
-
331
-
332
-
333
-
334
-
335
-
336
-
337
-
338
-
339
-
340
-
341
-
342
-
343
-
344
-
345
-
346
-
347
-
348
-
349
-
350
-
351
-
352
-
353
-
354
-
355
-
356
-
357
-
358
-
359
-
 360
360 -
 361
361 -
 362
362 -
 363
363 -
 364
364 -
 365
365 -
 366
366 -
 367
367 -
 368
368 -
 369
369 -
 370
370 -
 371
371 -
 372
372 -
 373
373 -
 374
374 -
 375
375 -
 376
376 -
 377
377 -
 378
378 -
 379
379 -
 380
380 -
381
-
382
-
383
-
384
-
385
-
386
-
387
-
388
-
389
-
390
-
391
-
392
-
393
-
394
-
395
-
396
-
397
-
398
-
399
-
400
-
401
-
402
-
403
-
404
-
405
-
406
-
407
-
408
-
409
-
410
-
411
-
412
-
413
-
414
-
415
-
416
-
417
-
418
-
419
-
420
-
421
-
422
-
423
-
424
-
425
-
426
-
427
-
428
-
429
-
430
-
431
-
432
-
433
-
434
-
435
-
436
-
437
-
438
-
439
-
440
 |
 |

HSBC HOLDINGS PLC
Notes on the Financial Statements (continued)
22 – Transfers of financial assets not qualifying for derecognition / 23 – Interests in associates and joint ventures
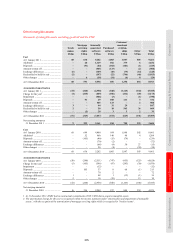
368
Within one year
After one year but
within five years
After five years but
within ten years After ten years
Amount Yield Amount Yield Amount Yield Amount Yield
US$m % US$m % US$m % US$m %
Held-to-maturity
US Treasury ............................................. 11 4.1 25 4.2 65 4.8 99 5.0
US Government agencies ........................ – – 1 7.6 5 7.7 381 6.5
US Government-sponsored agencies ....... 5 4.7 13 7.9 2 7.0 1,406 6.2
Hong Kong Government ......................... – – 5 0.9 10 4.1 3 1.2
Other governments .................................. 22 4.3 486 3.7 263 4.8 468 5.2
Asset-backed securities ........................... – – – – – – 166 6.2
Corporate debt and other securities ......... 1,221 3.9 6,899 4.1 6,960 4.4 2,502 5.5
Total amortised cost ................................. 1,259 7,429 7,305 5,025
Total carrying value ................................. 1,259 7,429 7,305 5,025
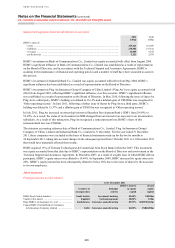
The maturity distributions of asset-backed securities are presented in the above table on the basis of contractual
maturity dates. The weighted average yield for each range of maturities is calculated by dividing the annualised
interest income for the year ended 31 December 2011 by the book amount of available-for-sale debt securities at
that date. The yields do not include the effect of related derivatives.
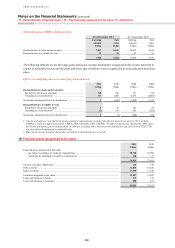
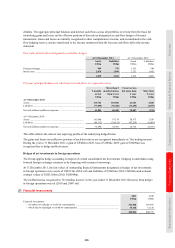
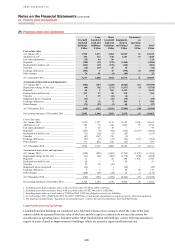
22 Transfers of financial assets not qualifying for derecognition
HSBC enters into transactions in the normal course of business by which it transfers recognised financial assets
directly to third parties or to SPEs. These transfers may give rise to the full or partial derecognition of the financial
assets concerned.
– Full derecognition occurs when HSBC transfers its contractual right to receive cash flows from the financial
assets, or retains the right but assumes an obligation to pass on the cash flows from the asset, and transfers
substantially all the risks and rewards of ownership. The risks include credit, interest rate, currency, prepayment
and other price risks.
– Partial derecognition occurs when HSBC sells or otherwise transfers financial assets in such a way that some but
not substantially all of the risks and rewards of ownership are transferred but control is retained. These financial
assets are recognised on the balance sheet to the extent of HSBC’s continuing involvement.
– HSBC will continue to recognise financial assets transferred when it retains substantially all the risks and
rewards of ownership.
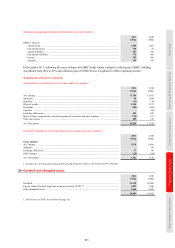
The majority of financial assets that do not qualify for derecognition are (i) debt securities held by counterparties
as collateral under repurchase agreements or (ii) equity securities lent under securities lending agreements. The
following table analyses the carrying amount of financial assets that did not qualify for derecognition and their
associated financial liabilities:
Financial assets and associated financial liabilities not qualifying for derecognition
2011 2010
Carrying
amount of
transferred
assets
Carrying
amount of
associated
liabilities
Carrying
amount of
transferred
assets
Carrying
amount of
associated
liabilities
US$m US$m US$m US$m
Nature of transaction
Repurchase agreements ................................................................ 124,982 124,413 124,625 122,455
Securities lending agreements ...................................................... 7,129 7,039 7,277 7,202
132,111 131,452 131,902 129,657
A small proportion of financial assets that do not qualify for derecognition relate to loans, credit cards, debt securities
and trade receivables that have been securitised under arrangements by which HSBC retains a continuing
involvement in such transferred assets. Continuing involvement may entail retaining the rights to future cash flows
arising from the assets after investors have received their contractual terms (for example, interest rate strips);
providing subordinated interest; liquidity support; continuing to service the underlying asset; or entering into