HSBC 2011 Annual Report Download - page 357
Download and view the complete annual report
Please find page 357 of the 2011 HSBC annual report below. You can navigate through the pages in the report by either clicking on the pages listed below, or by using the keyword search tool below to find specific information within the annual report.-
 1
1 -
2
-
3
-
4
-
5
-
6
-
7
-
8
-
9
-
10
-
11
-
12
-
13
-
14
-
15
-
16
-
17
-
18
-
19
-
20
-
21
-
22
-
23
-
24
-
25
-
26
-
27
-
28
-
29
-
30
-
31
-
32
-
33
-
34
-
35
-
36
-
37
-
38
-
39
-
40
-
41
-
42
-
43
-
44
-
45
-
46
-
47
-
48
-
49
-
50
-
51
-
52
-
53
-
54
-
55
-
56
-
57
-
58
-
59
-
60
-
61
-
62
-
63
-
64
-
65
-
66
-
67
-
68
-
69
-
70
-
71
-
72
-
73
-
74
-
75
-
76
-
77
-
78
-
79
-
80
-
81
-
82
-
83
-
84
-
85
-
86
-
87
-
88
-
89
-
90
-
91
-
92
-
93
-
94
-
95
-
96
-
97
-
98
-
99
-
100
-
101
-
102
-
103
-
104
-
105
-
106
-
107
-
108
-
109
-
110
-
111
-
112
-
113
-
114
-
115
-
116
-
117
-
118
-
119
-
120
-
121
-
122
-
123
-
124
-
125
-
126
-
127
-
128
-
129
-
130
-
131
-
132
-
133
-
134
-
135
-
136
-
137
-
138
-
139
-
140
-
141
-
142
-
143
-
144
-
145
-
146
-
147
-
148
-
149
-
150
-
151
-
152
-
153
-
154
-
155
-
156
-
157
-
158
-
159
-
160
-
161
-
162
-
163
-
164
-
165
-
166
-
167
-
168
-
169
-
170
-
171
-
172
-
173
-
174
-
175
-
176
-
177
-
178
-
179
-
180
-
181
-
182
-
183
-
184
-
185
-
186
-
187
-
188
-
189
-
190
-
191
-
192
-
193
-
194
-
195
-
196
-
197
-
198
-
199
-
200
-
201
-
202
-
203
-
204
-
205
-
206
-
207
-
208
-
209
-
210
-
211
-
212
-
213
-
214
-
215
-
216
-
217
-
218
-
219
-
220
-
221
-
222
-
223
-
224
-
225
-
226
-
227
-
228
-
229
-
230
-
231
-
232
-
233
-
234
-
235
-
236
-
237
-
238
-
239
-
240
-
241
-
242
-
243
-
244
-
245
-
246
-
247
-
248
-
249
-
250
-
251
-
252
-
253
-
254
-
255
-
256
-
257
-
258
-
259
-
260
-
261
-
262
-
263
-
264
-
265
-
266
-
267
-
268
-
269
-
270
-
271
-
272
-
273
-
274
-
275
-
276
-
277
-
278
-
279
-
280
-
281
-
282
-
283
-
284
-
285
-
286
-
287
-
288
-
289
-
290
-
291
-
292
-
293
-
294
-
295
-
296
-
297
-
298
-
299
-
300
-
301
-
302
-
303
-
304
-
305
-
306
-
307
-
308
-
309
-
310
-
311
-
312
-
313
-
314
-
315
-
316
-
317
-
318
-
319
-
320
-
321
-
322
-
323
-
324
-
325
-
326
-
327
-
328
-
329
-
330
-
331
-
332
-
333
-
334
-
335
-
336
-
337
-
338
-
339
-
340
-
341
-
342
-
343
-
344
-
345
-
346
-
 347
347 -
 348
348 -
 349
349 -
 350
350 -
 351
351 -
 352
352 -
 353
353 -
 354
354 -
 355
355 -
 356
356 -
 357
357 -
 358
358 -
 359
359 -
 360
360 -
 361
361 -
 362
362 -
 363
363 -
 364
364 -
 365
365 -
 366
366 -
 367
367 -
368
-
369
-
370
-
371
-
372
-
373
-
374
-
375
-
376
-
377
-
378
-
379
-
380
-
381
-
382
-
383
-
384
-
385
-
386
-
387
-
388
-
389
-
390
-
391
-
392
-
393
-
394
-
395
-
396
-
397
-
398
-
399
-
400
-
401
-
402
-
403
-
404
-
405
-
406
-
407
-
408
-
409
-
410
-
411
-
412
-
413
-
414
-
415
-
416
-
417
-
418
-
419
-
420
-
421
-
422
-
423
-
424
-
425
-
426
-
427
-
428
-
429
-
430
-
431
-
432
-
433
-
434
-
435
-
436
-
437
-
438
-
439
-
440
 |
 |

355
Overview Operating & Financial Review Corporate Governance Financial Statements Shareholder Information
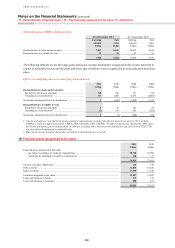
Reflected in profit or loss
Reflected in other
comprehensive income
Favourable
changes
Unfavourable
changes
Favourable
changes
Unfavourable
changes
US$m US$m US$m US$m
At 31 December 2010
Private equity investments ............................................................ 112 (71) 383 (383)
Asset-backed securities ................................................................ 8 (8) 179 (181)
Loans held for securitisation ........................................................ 8 (8) – –
Structured notes ............................................................................ 18 (16) – –
Derivatives with monolines .......................................................... 94 (8) – –
Other derivatives ........................................................................... 256 (258) – –
Other portfolios ............................................................................. 135 (150) 201 (180)
631 (519) 763 (744)
Favourable and unfavourable changes are determined on the basis of changes in the value of the instrument as a result
of varying the levels of the unobservable parameters using statistical techniques. When parameters are not amenable
to statistical analysis, quantification of uncertainty is judgemental.
When the fair value of a financial instrument is affected by more than one unobservable assumption, the above table
reflects the most favourable or most unfavourable change from varying the assumptions individually.
In respect of private equity investments, in many of the methodologies, the principal assumption is the valuation
multiple to be applied to the main financial indicators. This may be determined with reference to multiples for
comparable listed companies and includes discounts for marketability.
For ABSs, the principal assumptions in the models are based on benchmark information about prepayment speeds,
default rates, loss severities and the historical performance of the underlying assets.
For leveraged finance, loans held for securitisation and derivatives with monolines the principal assumption concerns
the appropriate value to be attributed to the counterparty credit risk. This requires estimation of exposure at default,
probability of default and recovery in the event of default. For loan transactions, assessment of exposure at default is
straightforward. For derivative transactions, a future exposure profile is generated on the basis of current market data.
Probabilities of default and recovery levels are estimated using available evidence, which may include financial
information, historical experience, CDS spreads and consensus recovery levels.
For structured notes and other derivatives, principal assumptions concern the value to be attributed to future volatility
of asset values and the future correlation between asset values. These principal assumptions include credit volatilities
and correlations used in the valuation of structured credit derivatives (including leveraged credit derivatives). For
such unobservable assumptions, estimates are based on available market data, which may include the use of a proxy
method to derive a volatility or a correlation from comparable assets for which market data is more readily available,
and/or an examination of historical levels.
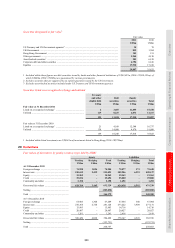
HSBC Holdings
The following table provides an analysis of the basis for valuing financial assets and financial liabilities measured at
fair value in the financial statements: