LeapFrog 2009 Annual Report Download - page 42
Download and view the complete annual report
Please find page 42 of the 2009 LeapFrog annual report below. You can navigate through the pages in the report by either clicking on the pages listed below, or by using the keyword search tool below to find specific information within the annual report.-
 1
1 -
2
-
3
-
4
-
5
-
6
-
7
-
8
-
9
-
10
-
11
-
12
-
13
-
14
-
15
-
16
-
17
-
18
-
19
-
20
-
21
-
22
-
23
-
24
-
25
-
26
-
27
-
28
-
29
-
30
-
31
-
 32
32 -
 33
33 -
 34
34 -
 35
35 -
 36
36 -
 37
37 -
 38
38 -
 39
39 -
 40
40 -
 41
41 -
 42
42 -
 43
43 -
 44
44 -
 45
45 -
 46
46 -
 47
47 -
 48
48 -
 49
49 -
 50
50 -
 51
51 -
 52
52 -
53
-
54
-
55
-
56
-
57
-
58
-
59
-
60
-
61
-
62
-
63
-
64
-
65
-
66
-
67
-
68
-
69
-
70
-
71
-
72
-
73
-
74
-
75
-
76
-
77
-
78
-
79
-
80
-
81
-
82
-
83
-
84
-
85
-
86
-
87
-
88
-
89
-
90
-
91
-
92
-
93
-
94
-
95
-
96
-
97
-
98
-
99
-
100
-
101
-
102
-
103
-
104
-
105
-
106
-
107
-
108
-
109
-
110
-
111
-
112
-
113
-
114
-
115
-
116
-
117
-
118
-
119
-
120
-
121
-
122
-
123
-
124
-
125
-
126
-
127
-
128
-
129
-
130
-
131
-
132
-
133
-
134
-
135
-
136
-
137
-
138
-
139
-
140
-
141
-
142
-
143
-
144
-
145
-
146
-
147
-
148
-
149
-
150
-
151
-
152
-
153
-
154
-
155
-
156
-
157
-
158
-
159
-
160
-
161
-
162
-
163
-
164
-
165
-
166
-
167
-
168
-
169
-
170
-
171
-
172
-
173
-
174
-
175
-
176
-
177
-
178
-
179
-
180
 |
 |

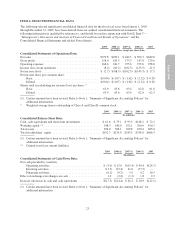
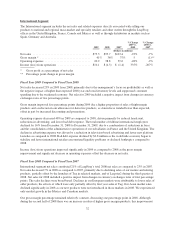
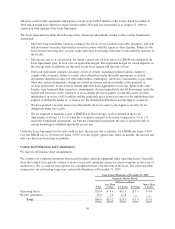
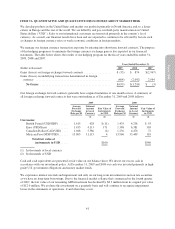
International Segment
The International segment includes the net sales and related expenses directly associated with selling our
products to national and regional mass-market and specialty retailers and other outlets through the LeapFrog
offices in the United Kingdom, France, Canada and Mexico as well as through distributors in markets such as
Spain, Germany and Australia.
2009 2008 2007
% Change
2009 vs.
2008
% Change
2008 vs.
2007
(Dollars in millions)
Net sales ....................................... $73.3 $95.7 $103.4 -23% -7%
Gross margin * .................................. 41% 36% 37% 5 (1)**
Operating expenses ............................... 20.2 38.8 39.6 -48% -2%
Income (loss) from operations ...................... $10.1 $ (4.3) $ (1.4) 335% -207%
* Gross profit as a percentage of net sales
** Percentage point change in gross margin
Fiscal Year 2009 Compared to Fiscal Year 2008
Net sales decreased 23% in 2009 from 2008, primarily due to the management’s focus on profitability as well as
the negative impact of higher than expected 2008 year-end retail inventory levels and suppressed consumer
spending due to the weakened economy. Net sales for 2009 included a negative impact from changes in currency
exchanges rates of two percentage points.
Gross margin improved five percentage points during 2009 due a higher proportion of sales of high-margin
products and a reduction in our allowance for defective products, as claims have trended lower than expected,
offset in part by increased discounting and promotions.
Operating expense decreased 48% in 2009 as compared to 2008, driven primarily by reduced headcount,
reductions in advertising, and lower bad debt expense. The total number of fulltime international employees
declined by 16% from December 31, 2008 to December 31, 2009, due to a combination of reductions in force
and the consolidation of the administrative operations of our subsidiaries in France and the United Kingdom. The
decline in advertising expense was driven by a reduction in television-based advertising and fewer new platform
launches as compared to 2008. Bad debt expense declined by $2.8 million as the worldwide economy began to
stabilize and fewer international retailers encountered liquidity problems or declared bankruptcy compared to
2008.
Income (loss) from operations improved significantly in 2009 as compared to 2008 as the gross margin
improvement and significant decrease in operating expenses offset the decrease in net sales.
Fiscal Year 2008 Compared to Fiscal Year 2007
International segment net sales constituted 21% of LeapFrog’s total 2008 net sales as compared to 23% in 2007.
Net sales decreased 7% in 2008 as compared to 2007, primarily due to declining sales of our mature and retiring
products, partially offset by the launches of Tag in selected markets, and of Leapster2 during the third quarter of
2008. Net sales for 2008 included a positive impact from changes in currency exchanges rates of four percentage
points. The sales declines were broad-based. Declines in our European markets were attributable to lower sales of
older products, the effects of which were only partially offset by first year sales of Tag. Our Asian market sales
declined significantly in 2008 as our new products were not introduced in those markets in 2008. We experienced
only modest growth in the Mexico and Canadian markets.
Our gross margin percentage remained relatively constant, decreasing one percentage point in 2008. Although
during the second half of 2008 there was an increase in sales of higher gross margin products, this improvement
32