LeapFrog 2009 Annual Report Download - page 56
Download and view the complete annual report
Please find page 56 of the 2009 LeapFrog annual report below. You can navigate through the pages in the report by either clicking on the pages listed below, or by using the keyword search tool below to find specific information within the annual report.-
 1
1 -
2
-
3
-
4
-
5
-
6
-
7
-
8
-
9
-
10
-
11
-
12
-
13
-
14
-
15
-
16
-
17
-
18
-
19
-
20
-
21
-
22
-
23
-
24
-
25
-
26
-
27
-
28
-
29
-
30
-
31
-
32
-
33
-
34
-
35
-
36
-
37
-
38
-
39
-
40
-
41
-
42
-
43
-
44
-
45
-
 46
46 -
 47
47 -
 48
48 -
 49
49 -
 50
50 -
 51
51 -
 52
52 -
 53
53 -
 54
54 -
 55
55 -
 56
56 -
 57
57 -
 58
58 -
 59
59 -
 60
60 -
 61
61 -
 62
62 -
 63
63 -
 64
64 -
 65
65 -
 66
66 -
67
-
68
-
69
-
70
-
71
-
72
-
73
-
74
-
75
-
76
-
77
-
78
-
79
-
80
-
81
-
82
-
83
-
84
-
85
-
86
-
87
-
88
-
89
-
90
-
91
-
92
-
93
-
94
-
95
-
96
-
97
-
98
-
99
-
100
-
101
-
102
-
103
-
104
-
105
-
106
-
107
-
108
-
109
-
110
-
111
-
112
-
113
-
114
-
115
-
116
-
117
-
118
-
119
-
120
-
121
-
122
-
123
-
124
-
125
-
126
-
127
-
128
-
129
-
130
-
131
-
132
-
133
-
134
-
135
-
136
-
137
-
138
-
139
-
140
-
141
-
142
-
143
-
144
-
145
-
146
-
147
-
148
-
149
-
150
-
151
-
152
-
153
-
154
-
155
-
156
-
157
-
158
-
159
-
160
-
161
-
162
-
163
-
164
-
165
-
166
-
167
-
168
-
169
-
170
-
171
-
172
-
173
-
174
-
175
-
176
-
177
-
178
-
179
-
180
 |
 |

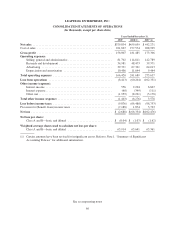
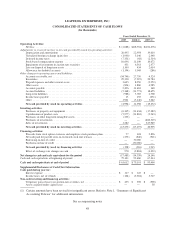
LEAPFROG ENTERPRISES, INC.
CONSOLIDATED STATEMENTS OF OPERATIONS
(In thousands, except per share data)
Years Ended December 31,
2009 2008 (1) 2007 (1)
Net sales ...................................................... $379,834 $459,059 $ 442,271
Cost of sales ................................................... 221,827 277,574 268,965
Gross profit ................................................... 158,007 181,485 173,306
Operating expenses:
Selling, general and administrative .............................. 81,702 114,811 142,789
Research and development .................................... 34,981 48,473 59,371
Advertising ................................................ 39,331 67,361 64,013
Depreciation and amortization ................................. 10,406 11,044 9,464
Total operating expenses ........................................ 166,420 241,689 275,637
Loss from operations ........................................... (8,413) (60,204) (102,331)
Other income (expense):
Interest income ............................................. 556 2,294 6,867
Interest expense ............................................. (60) (349) (111)
Other, net .................................................. (1,959) (8,221) (3,178)
Total other income (expense) ..................................... (1,463) (6,276) 3,578
Loss before income taxes ........................................ (9,876) (66,480) (98,753)
Provision for (Benefit from) income taxes ............................ (7,188) 1,874 3,723
Net loss ....................................................... $ (2,688) $ (68,354) $(102,476)
Net loss per share:
Class A and B—basic and diluted .............................. $ (0.04) $ (1.07) $ (1.62)
Weighted average shares used to calculate net loss per share:
Class A and B—basic and diluted .............................. 63,914 63,641 63,361
(1) Certain amounts have been revised for insignificant errors. Refer to Note 1, “Summary of Significant
Accounting Policies” for additional information.
See accompanying notes
46